ArxivLens

Publication

Published: Jul 06, 2026
Categories: cs.LG, q-bio.QM, stat.ML

Metrics

Source: ArXiv

AI Quick Summary

The paper shows that evaluating single-cell perturbations by per-cell accuracy is misleading when populations overlap; instead, scoring perturbations across the whole cell population yields far better identification. By averaging a classifier’s per-cell outputs to create a population profile, the proposed Classifier Discrimination Score (CDS) reliably ranks the true perturbation, often outperforming raw gene-expression baselines and requiring no retraining, with robustness growing as cell numbers decline.

Quick Answers

What is "Score Distributions, Not Cells: Evaluating Single-Cell Perturbations Under Class Overlap" about?

The paper shows that evaluating single-cell perturbations by per-cell accuracy is misleading when populations overlap; instead, scoring perturbations across the whole cell population yields far better identification. By averaging a classifier’s per-cell outputs to create a population profile, the proposed Classifier Discrimination Score (CDS) reliably ranks the true perturbation, often outperforming raw gene-expression baselines and requiring no retraining, with robustness growing as cell numbers decline.

What methodology did the authors use?

The study evaluates perturbation discrimination by shifting evaluation from per-cell accuracy to population-level scoring. It trains standard single-cell classifiers (linear, MLP, Transformer) as before but reads out predictions by averaging per-cell probability vectors across all cells of each perturbation to form a population profile, then ranks perturbations by this profile (Classifier Discrimination Score, CDS). CDS is compared to the Perturbation... More in Methodology →

What are the key results?

CDS recovers near-perfect identification on both datasets, with rank-1 accuracy ranging from 0.976 to 1.000, despite cell-level accuracies being low. — CDS outperforms PDS, especially as cell counts decline, indicating population-level averaging in discriminative space yields more reliable perturbation identification. More in Key Results →

Why is this work significant?

The metric reveals perturbation identity by aggregating information across cell populations rather than relying on noisy per-cell predictions, enabling reliable evaluation of perturbation models under class overlap and informing fair model comparison when cell-level signals are limited. More in Significance →

What are the main limitations?

CDS depends on the classifier's learned probabilistic space; miscalibration could affect population scores. — The approach assesses perturbation discrimination accuracy rather than direct perturbation prediction quality, potentially conflating identification with model spacing. More in Limitations →

Paper Preview

Abstract

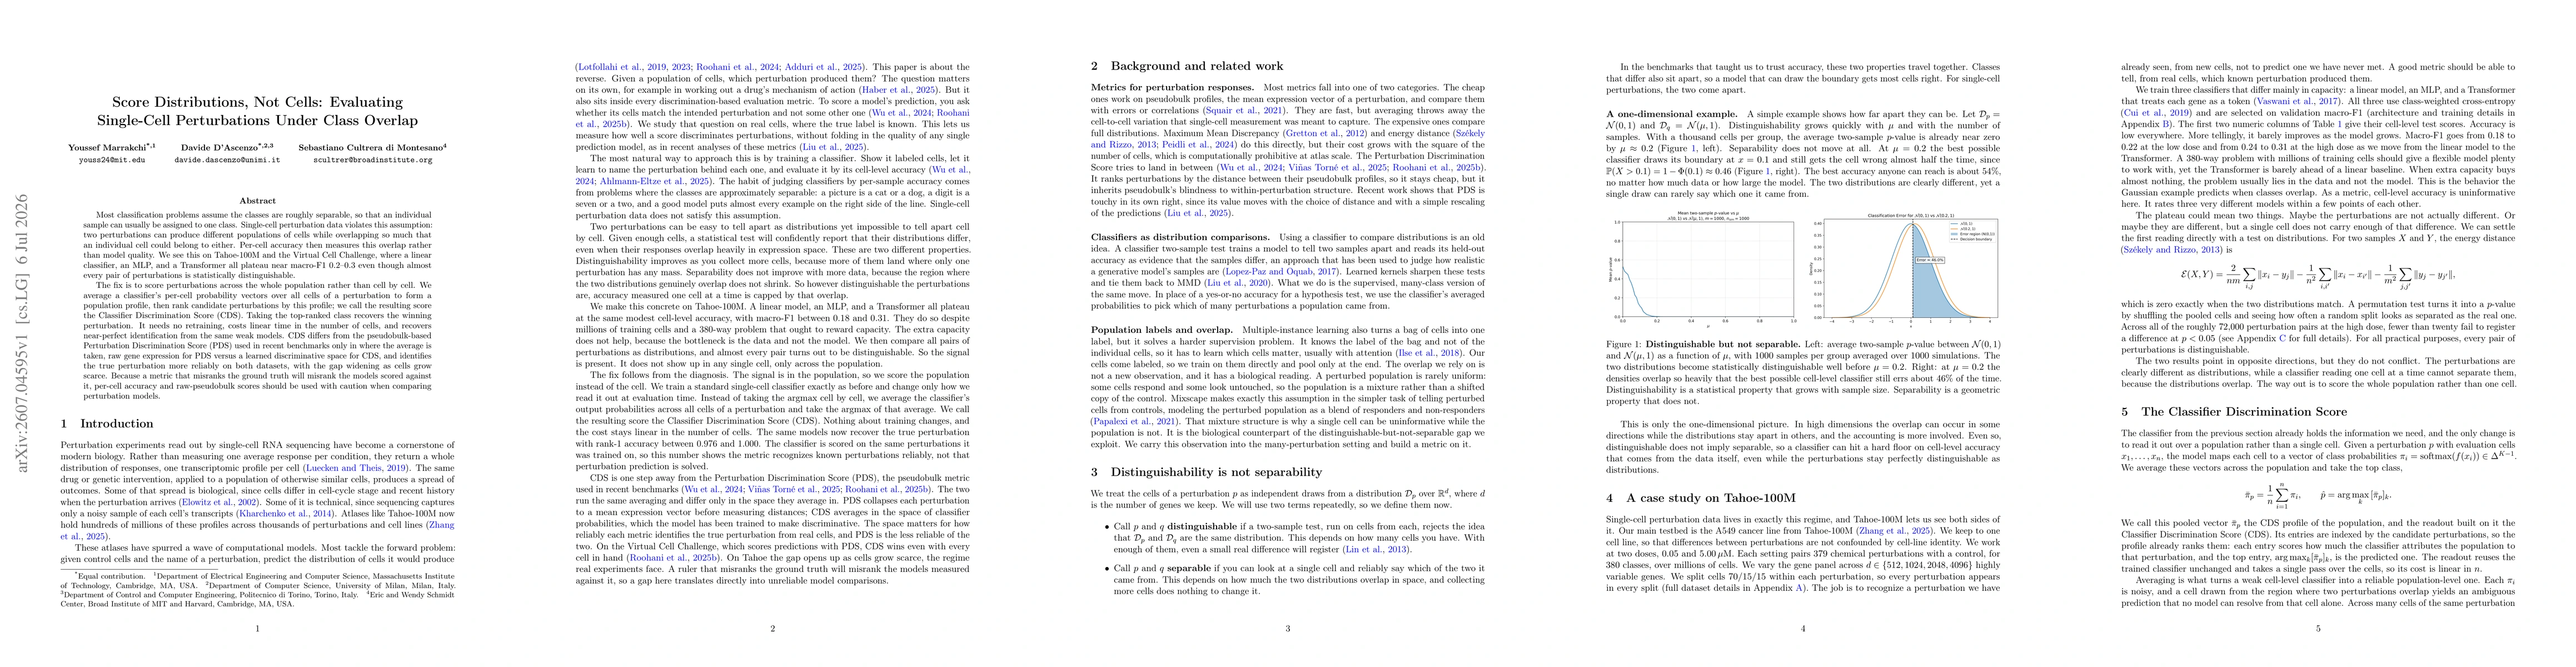
Most classification problems assume the classes are roughly separable, so that an individual sample can usually be assigned to one class. Single-cell perturbation data violates this assumption: two perturbations can produce different populations of cells while overlapping so much that an individual cell could belong to either. Per-cell accuracy then measures this overlap rather than model quality. We see this on Tahoe-100M and the Virtual Cell Challenge, where a linear classifier, an MLP, and a Transformer all plateau near macro-F1 0.2-0.3 even though almost every pair of perturbations is statistically distinguishable. The fix is to score perturbations across the whole population rather than cell by cell. We average a classifier's per-cell probability vectors over all cells of a perturbation to form a population profile, then rank candidate perturbations by this profile; we call the resulting score the Classifier Discrimination Score (CDS). Taking the top-ranked class recovers the winning perturbation. It needs no retraining, costs linear time in the number of cells, and recovers near-perfect identification from the same weak models. CDS differs from the pseudobulk-based Perturbation Discrimination Score (PDS) used in recent benchmarks only in where the average is taken, raw gene expression for PDS versus a learned discriminative space for CDS, and identifies the true perturbation more reliably on both datasets, with the gap widening as cells grow scarce. Because a metric that misranks the ground truth will misrank the models scored against it, per-cell accuracy and raw-pseudobulk scores should be used with caution when comparing perturbation models.

Key Findings, in focus

Seven facets of this paper, analysed and brought into focus by AI.

AI-generated · verify against source Generated Jul 08, 2026
In focus · one-line synthesis

The metric reveals perturbation identity by aggregating information across cell populations rather than relying on noisy per-cell predictions, enabling reliable evaluation of perturbation models under class overlap and informing fair model comparison when cell-level signals are limited.

01
MethodologyHow they did it

The study evaluates perturbation discrimination by shifting evaluation from per-cell accuracy to population-level scoring. It trains standard single-cell classifiers (linear, MLP, Transformer) as before but reads out predictions by averaging per-cell probability vectors across all cells of each perturbation to form a population profile, then ranks perturbations by this profile (Classifier Discrimination Score, CDS). CDS is compared to the Perturbation Discrimination Score (PDS), which uses raw pseudobulk means; CDS uses a learned discriminative space (classifier probabilities) for averaging. The approach requires no retraining and scales linearly with the number of cells, demonstrated on Tahoe-100M and Virtual Cell Challenge datasets.

02
ResultsWhat they found
  • CDS recovers near-perfect identification on both datasets, with rank-1 accuracy ranging from 0.976 to 1.000, despite cell-level accuracies being low.
  • CDS outperforms PDS, especially as cell counts decline, indicating population-level averaging in discriminative space yields more reliable perturbation identification.
  • On Virtual Cell Challenge, CDS achieves winning performance across perturbations, even when PDS struggles, illustrating robustness to dataset-specific scoring.
03
SignificanceWhy it matters

The metric reveals perturbation identity by aggregating information across cell populations rather than relying on noisy per-cell predictions, enabling reliable evaluation of perturbation models under class overlap and informing fair model comparison when cell-level signals are limited.

04
Technical ContributionsWhat's new technically

Introduces Classifier Discrimination Score (CDS), a population-level perturbation scoring metric that averages per-cell classifier probabilities across perturbation cells to form population profiles, and demonstrates its superiority over pseudobulk-based metrics (PDS) in identifying the true perturbation.

05
NoveltyWhat sets it apart

The work shifts evaluation from cell-wise accuracy to population-level discrimination using learned classifier probability spaces, distinguishing CDS from PDS by the space in which averaging occurs and showing improved reliability for perturbation identification under class overlap.

06
LimitationsWhat to be cautious about
  • CDS depends on the classifier's learned probabilistic space; miscalibration could affect population scores.
  • The approach assesses perturbation discrimination accuracy rather than direct perturbation prediction quality, potentially conflating identification with model spacing.
  • Results focus on two large datasets; generalizability to other modalities or perturbation schemes remains to be validated.
07
Future WorkWhere it goes next
  • Investigate calibrating classifier probabilities to further stabilize CDS across diverse datasets.
  • Explore extensions of CDS to multi-task or hierarchical perturbation schemes and different population aggregation strategies.
  • Assess CDS robustness under varying sequencing depth and batch effects to generalize across single-cell perturbation studies.

Paper Details

Paper ID: 2607.04595
Categories:
cs.LG q-bio.QM stat.ML

How to Cite This Paper

Reference manager: RIS EndNote


Discussion 0

This website uses cookies to ensure you get the best experience. Learn more