Authors
Summary
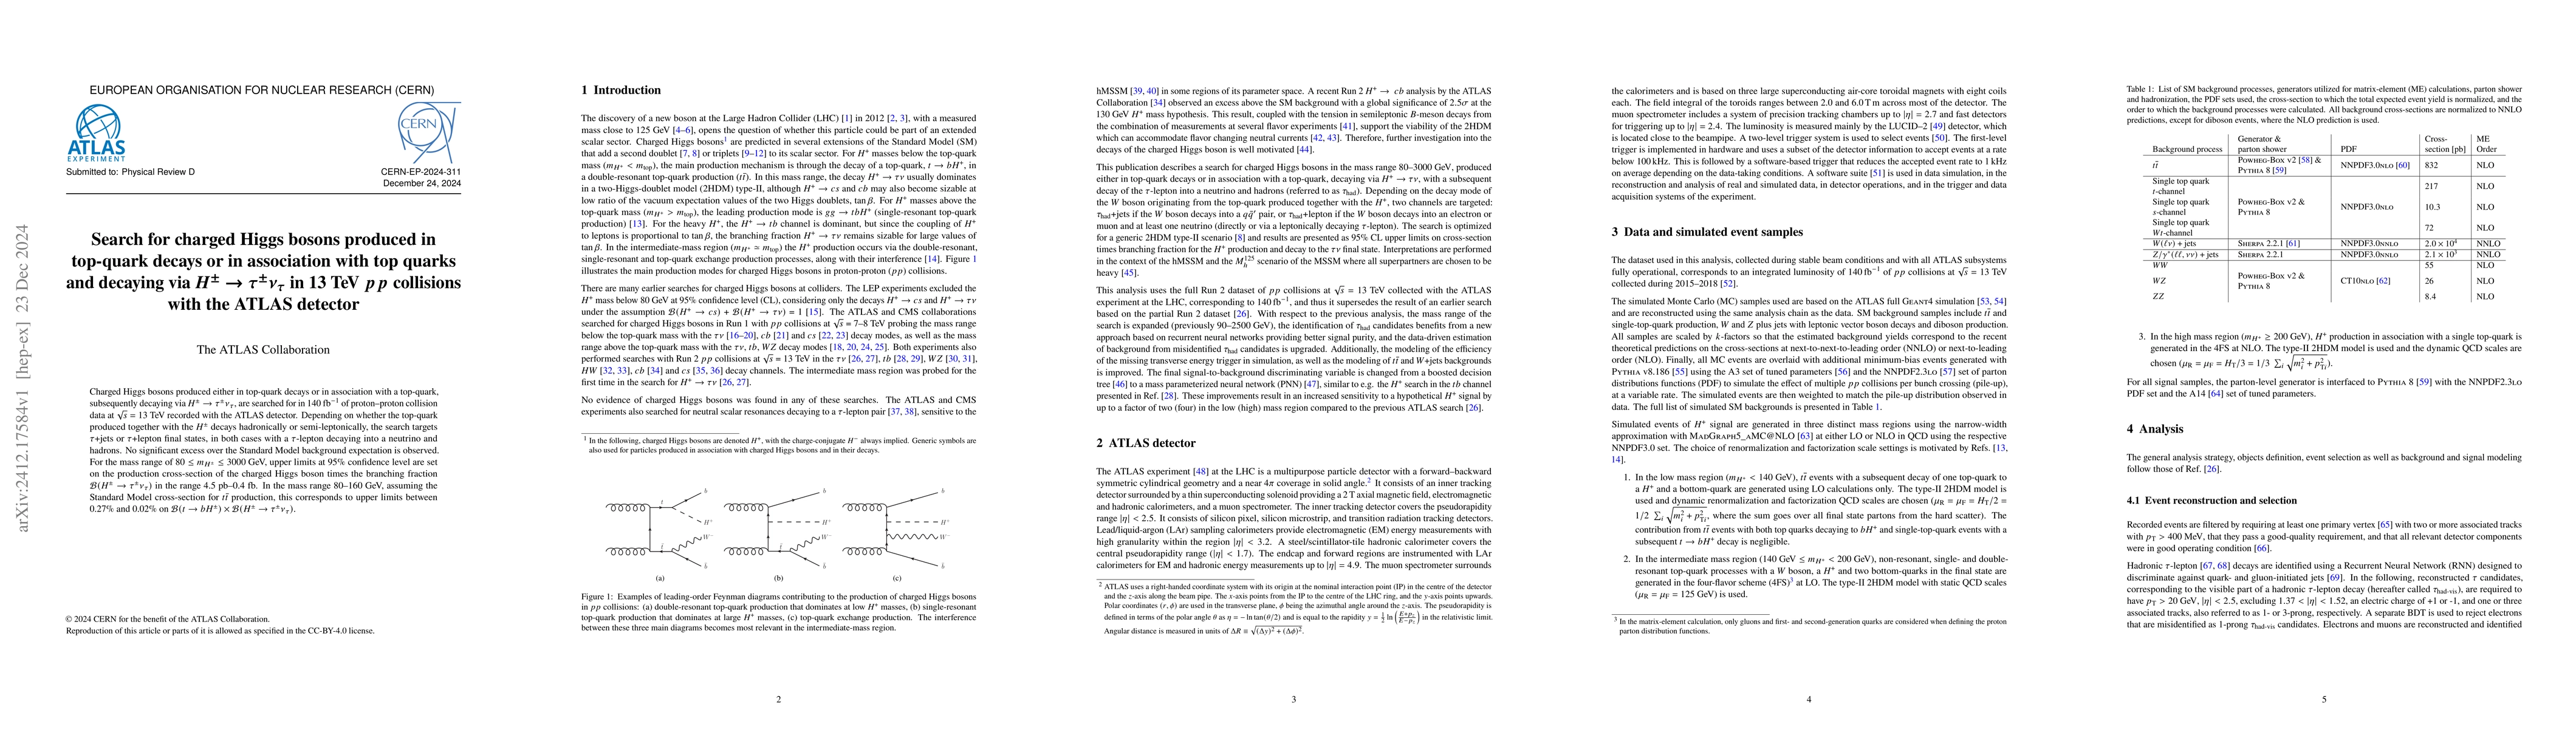
Charged Higgs bosons produced either in top-quark decays or in association with a top-quark, subsequently decaying via $H^{\pm} \to \tau^{\pm}\nu_{\tau}$, are searched for in 140 $\text{fb}^{-1}$ of proton-proton collision data at $\sqrt{s}=13$ TeV recorded with the ATLAS detector. Depending on whether the top-quark produced together with the $H^{\pm}$ decays hadronically or semi-leptonically, the search targets $\tau$+jets or $\tau$+lepton final states, in both cases with a $\tau$-lepton decaying into a neutrino and hadrons. No significant excess over the Standard Model background expectation is observed. For the mass range of $80 \leq m_{H^{\pm}} \leq 3000$ GeV, upper limits at 95% confidence level are set on the production cross-section of the charged Higgs boson times the branching fraction $\mathrm{\cal{B}}(H^{\pm} \to \tau^{\pm}\nu_{\tau})$ in the range 4.5 pb-0.4 fb. In the mass range 80-160 GeV, assuming the Standard Model cross-section for $t\bar{t}$ production, this corresponds to upper limits between 0.27% and 0.02% on $\mathrm{\cal{B}}(t\to bH^{\pm}) \times \mathrm{\cal{B}}(H^{\pm} \to \tau^{\pm}\nu_{\tau})$.
AI Key Findings
Get AI-generated insights about this paper's methodology, results, and significance.
Paper Details
PDF Preview
Similar Papers
Found 4 papersNo citations found for this paper.
Comments (0)