Publication
Metrics
Paper Preview
Abstract
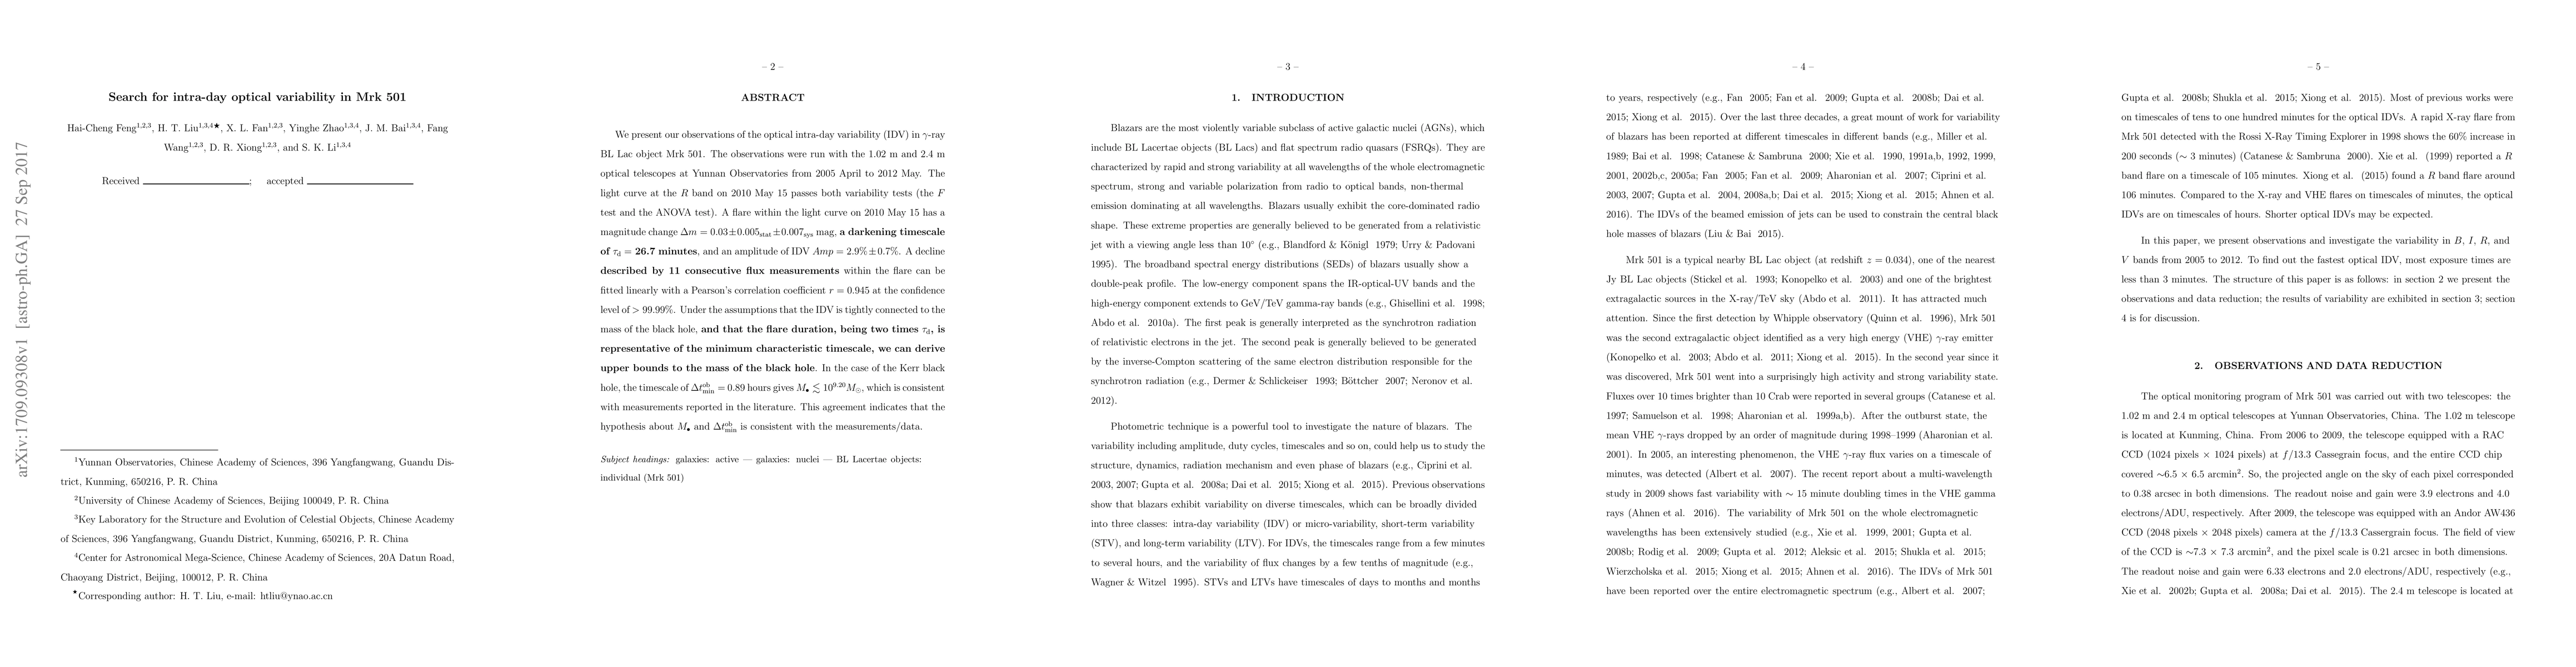
We present our observations of the optical intra-day variability (IDV) in $\gamma$-ray BL Lac object Mrk 501. The observations were run with the 1.02 m and 2.4 m optical telescopes at Yunnan Observatories from 2005 April to 2012 May. The light curve at the $R$ band on 2010 May 15 passes both variability tests (the $F$ test and the ANOVA test). A flare within the light curve on 2010 May 15 has a magnitude change $\Delta m = 0.03 \pm 0.005_{\rm{stat}} \pm 0.007_{\rm{sys}}$ mag, \textbf{a darkening timescale of $\tau_{\rm{d}}=$ 26.7 minutes}, and an amplitude of IDV $Amp=2.9\% \pm0.7\%$. A decline \textbf{described by 11 consecutive flux measurements} within the flare can be fitted linearly with a Pearson's correlation coefficient $r = 0.945$ at the confidence level of $> 99.99\%$. Under the assumptions that the IDV is tightly connected to the mass of the black hole, \textbf{and that the flare duration, being two times $\tau_{\rm{d}}$, is representative of the minimum characteristic timescale, we can derive upper bounds to the mass of the black hole}. In the case of the Kerr black hole, the timescale of $\Delta t_{\rm{min}}^{\rm{ob}}=$ 0.89 hours gives $M_{\bullet}\la 10^{9.20} M_{\odot}$, which is consistent with measurements reported in the literature. This agreement indicates that the hypothesis about $M_{\bullet}$ and $\Delta t_{\rm{min}}^{\rm{ob}}$ is consistent with the measurements/data.
AI Key Findings
Get AI-generated insights about this paper's methodology, results, significance, and more — seven facets brought into focus.
Impact
Paper Details
PDF Preview
Key Terms
Citation Network
Current paper (gray), citations (green), references (blue)
Display is limited for performance on very large graphs.
Discussion 0