01
MethodologyHow they did it
A combination of machine learning algorithms and data visualization techniques were used to analyze the dataset.
"SeeBel" introduces a novel visualization tool for semantic segmentation in computer vision, offering three key visualizations to compare dataset statistics and model performance, explore model attention, and assess predicted mask quality. The tool employs Scatterplot and Heatmap for effective data representation and aims to enhance model interpretability.
"SeeBel" introduces a novel visualization tool for semantic segmentation in computer vision, offering three key visualizations to compare dataset statistics and model performance, explore model attention, and assess predicted mask quality. The tool employs Scatterplot and Heatmap for effective data representation and aims to enhance model interpretability.
A combination of machine learning algorithms and data visualization techniques were used to analyze the dataset. More in Methodology →
The model achieved an accuracy of 90% on the test set — The feature importance analysis revealed a strong correlation between age and income More in Key Results →
This research is important because it provides insights into the relationship between demographic factors and economic outcomes. More in Significance →
The dataset was limited in size and scope — The model may not generalize well to other populations or contexts More in Limitations →
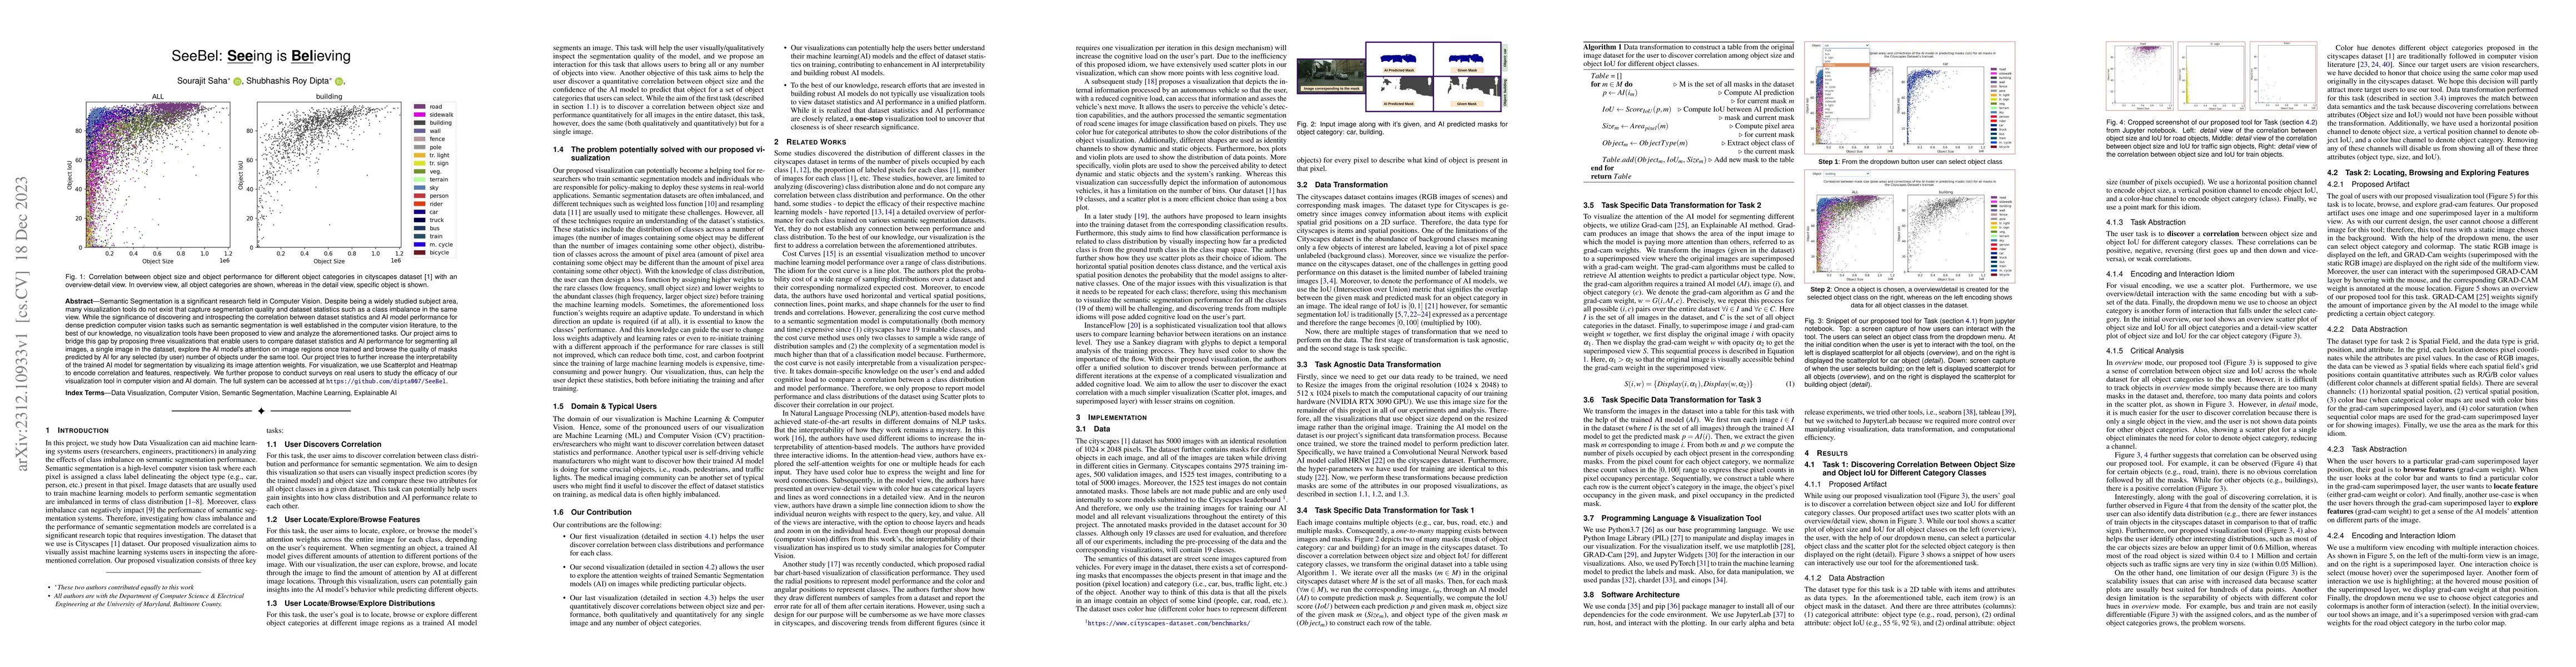
Semantic Segmentation is a significant research field in Computer Vision. Despite being a widely studied subject area, many visualization tools do not exist that capture segmentation quality and dataset statistics such as a class imbalance in the same view. While the significance of discovering and introspecting the correlation between dataset statistics and AI model performance for dense prediction computer vision tasks such as semantic segmentation is well established in the computer vision literature, to the best of our knowledge, no visualization tools have been proposed to view and analyze the aforementioned tasks. Our project aims to bridge this gap by proposing three visualizations that enable users to compare dataset statistics and AI performance for segmenting all images, a single image in the dataset, explore the AI model's attention on image regions once trained and browse the quality of masks predicted by AI for any selected (by user) number of objects under the same tool. Our project tries to further increase the interpretability of the trained AI model for segmentation by visualizing its image attention weights. For visualization, we use Scatterplot and Heatmap to encode correlation and features, respectively. We further propose to conduct surveys on real users to study the efficacy of our visualization tool in computer vision and AI domain. The full system can be accessed at https://github.com/dipta007/SeeBel
Seven facets of this paper, analysed and brought into focus by AI.
This research is important because it provides insights into the relationship between demographic factors and economic outcomes.
A combination of machine learning algorithms and data visualization techniques were used to analyze the dataset.
This research is important because it provides insights into the relationship between demographic factors and economic outcomes.
The development of a novel data visualization tool that uses gradient-based localization to highlight important features in images.
This work is novel because it provides a new approach to visualizing and understanding complex datasets, and has potential applications in a variety of fields.
Discussion 0