Seeing the Forest through the Trees: Adaptive Local Exploration of Large Graphs
Publication
Metrics
AI Quick Summary
This paper proposes FACETS, a scalable method for adaptively exploring large million-node graphs by focusing on locally interesting neighborhoods, measured by surprisingness and fit to user-selected nodes. Empirical evaluations show FACETS effectively aligns with user interests and scales linearly for large graph exploration.
Paper Preview
Abstract
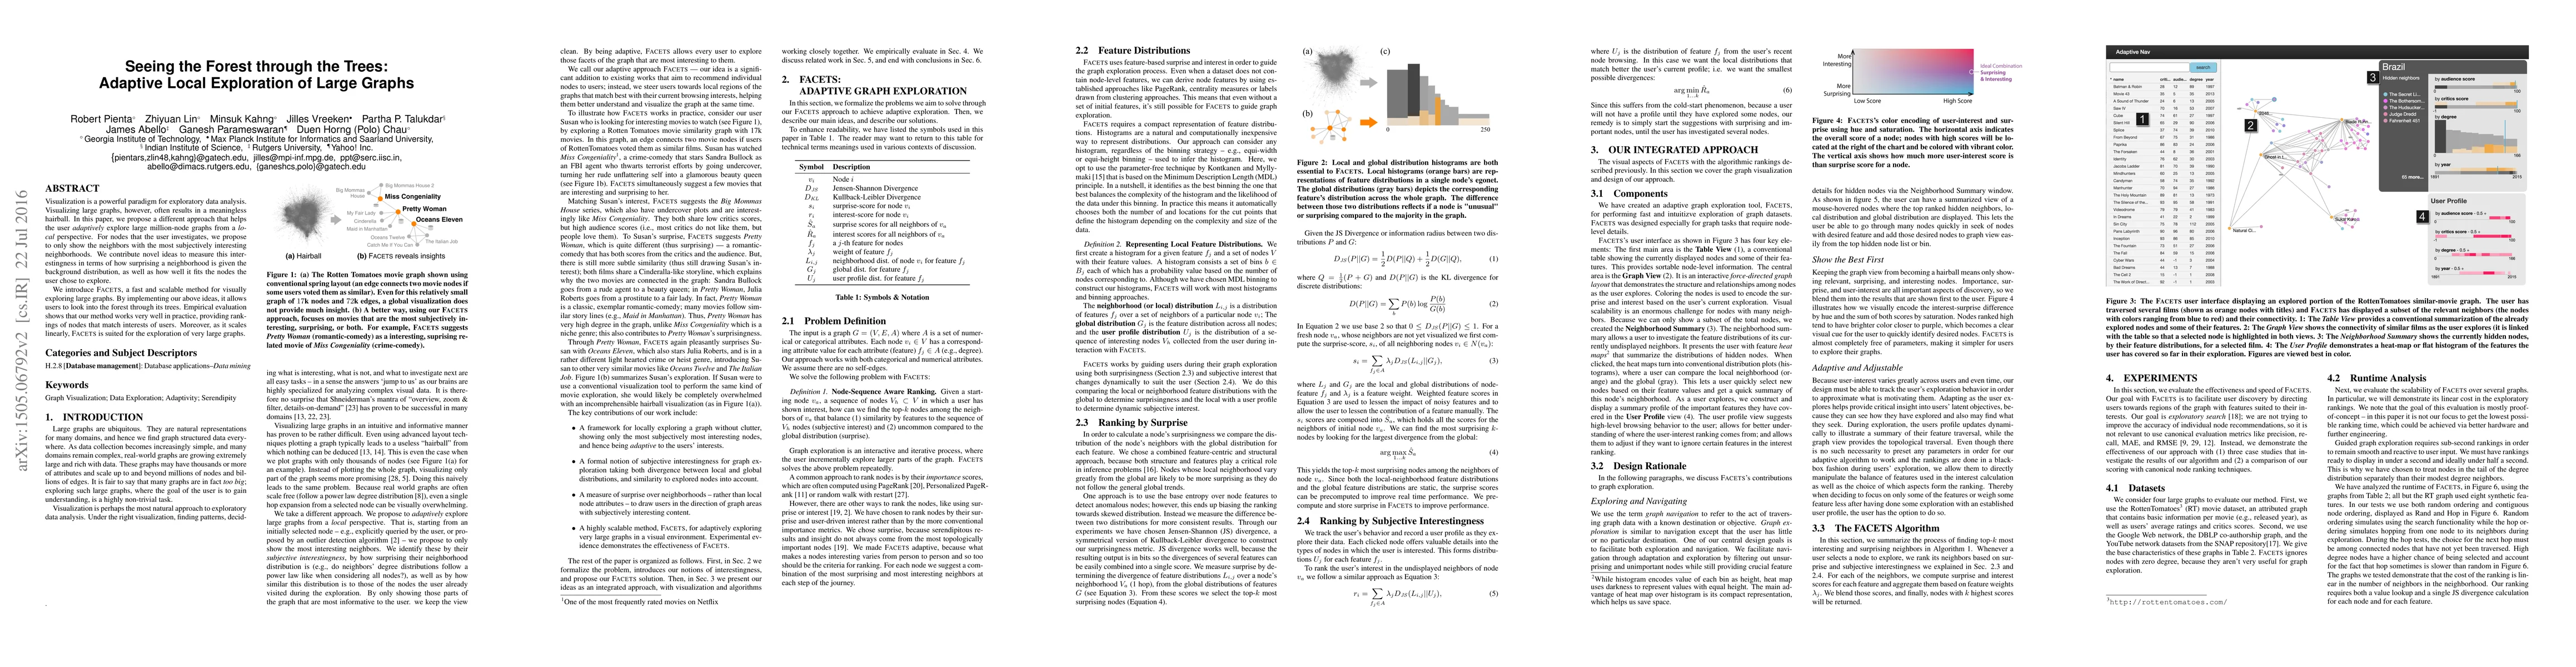
Visualization is a powerful paradigm for exploratory data analysis. Visualizing large graphs, however, often results in a meaningless hairball. In this paper, we propose a different approach that helps the user adaptively explore large million-node graphs from a local perspective. For nodes that the user investigates, we propose to only show the neighbors with the most subjectively interesting neighborhoods. We contribute novel ideas to measure this interestingness in terms of how surprising a neighborhood is given the background distribution, as well as how well it fits the nodes the user chose to explore. We introduce FACETS, a fast and scalable method for visually exploring large graphs. By implementing our above ideas, it allows users to look into the forest through its trees. Empirical evaluation shows that our method works very well in practice, providing rankings of nodes that match interests of users. Moreover, as it scales linearly, FACETS is suited for the exploration of very large graphs.
AI Key Findings
Get AI-generated insights about this paper's methodology, results, significance, and more — seven facets brought into focus.
Impact
Paper Details
PDF Preview
Key Terms
Citation Network
Current paper (gray), citations (green), references (blue)
Display is limited for performance on very large graphs.
Discussion 0