Segmentation Network with Compound Loss Function for Hydatidiform Mole Hydrops Lesion Recognition
Publication
Metrics
AI Quick Summary
This paper presents a segmentation network with a compound loss function to improve the recognition of hydrops lesions in hydatidiform moles. The model employs a stagewise training method combining different loss functions for pixel and lesion level segmentation, achieving superior performance in medical image recognition tasks.
Paper Preview
Abstract
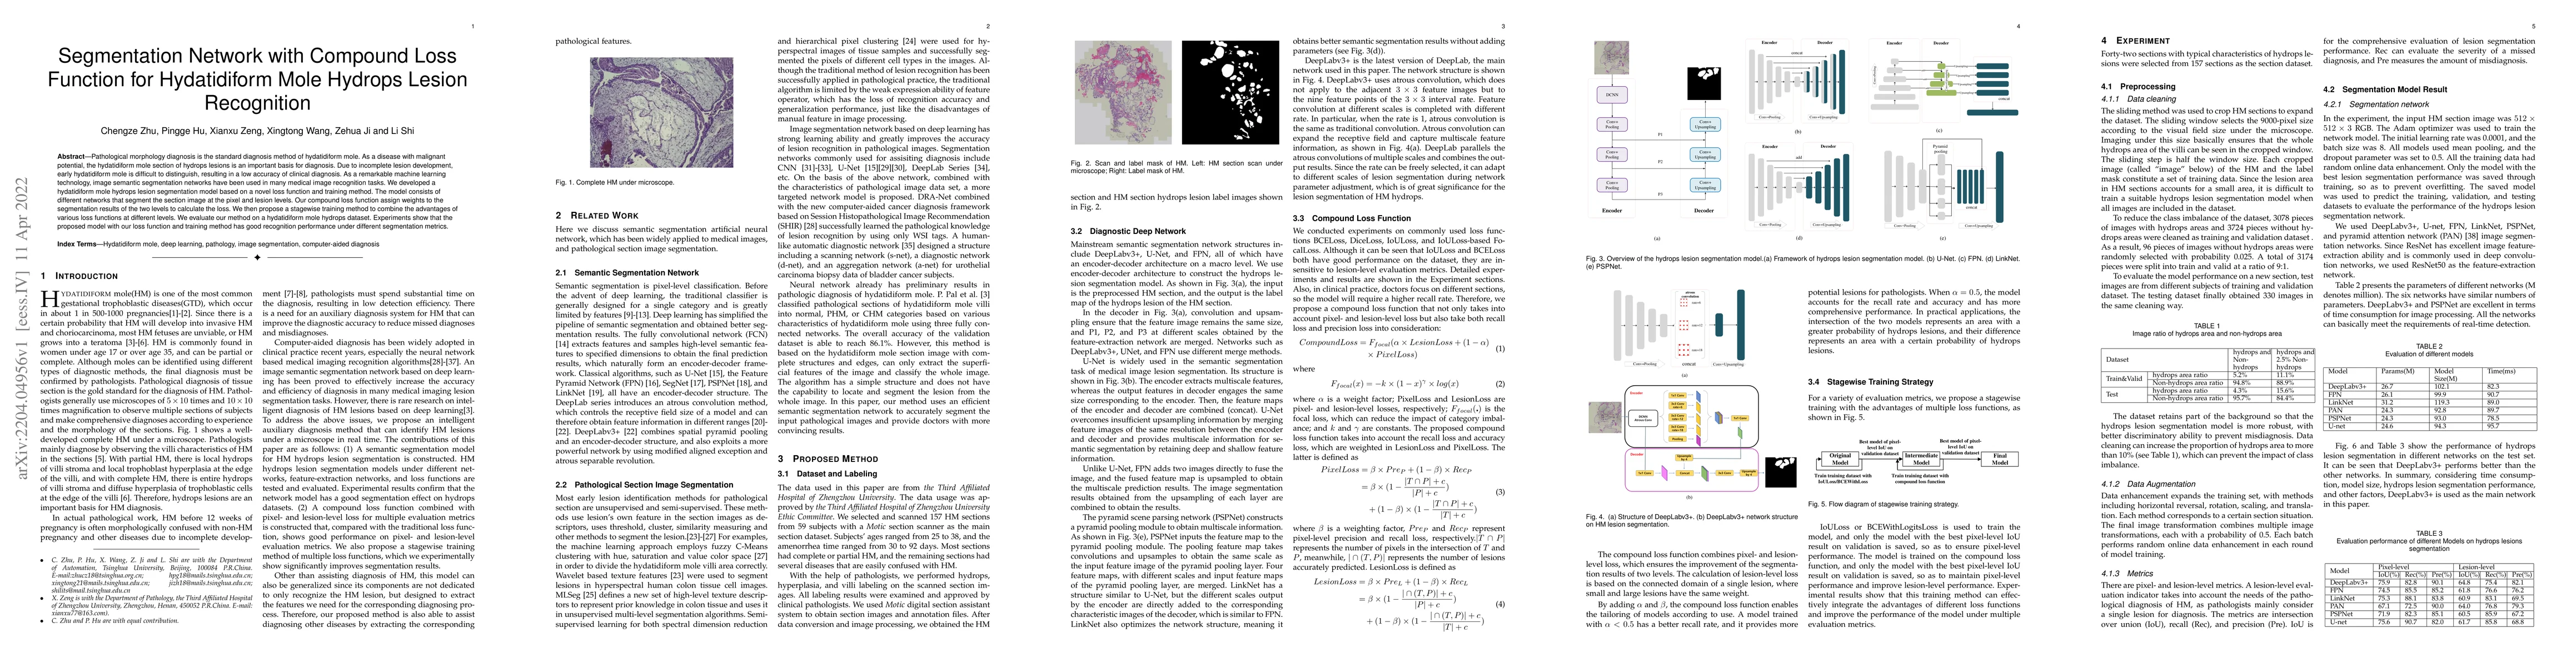
Pathological morphology diagnosis is the standard diagnosis method of hydatidiform mole. As a disease with malignant potential, the hydatidiform mole section of hydrops lesions is an important basis for diagnosis. Due to incomplete lesion development, early hydatidiform mole is difficult to distinguish, resulting in a low accuracy of clinical diagnosis. As a remarkable machine learning technology, image semantic segmentation networks have been used in many medical image recognition tasks. We developed a hydatidiform mole hydrops lesion segmentation model based on a novel loss function and training method. The model consists of different networks that segment the section image at the pixel and lesion levels. Our compound loss function assign weights to the segmentation results of the two levels to calculate the loss. We then propose a stagewise training method to combine the advantages of various loss functions at different levels. We evaluate our method on a hydatidiform mole hydrops dataset. Experiments show that the proposed model with our loss function and training method has good recognition performance under different segmentation metrics.
AI Key Findings
Get AI-generated insights about this paper's methodology, results, significance, and more — seven facets brought into focus.
Impact
Paper Details
Authors
PDF Preview
Key Terms
Citation Network
Current paper (gray), citations (green), references (blue)
Display is limited for performance on very large graphs.
Discussion 0