SeismographAPI: Visualising Temporal-Spatial Crisis Data
Publication
Metrics
AI Quick Summary
SeismographAPI is an open-source library for visualizing temporal-spatial crisis data, providing easy-to-use connectors, broad functionality, and runtime efficiency to support rapid crisis responses.
Paper Preview
Abstract
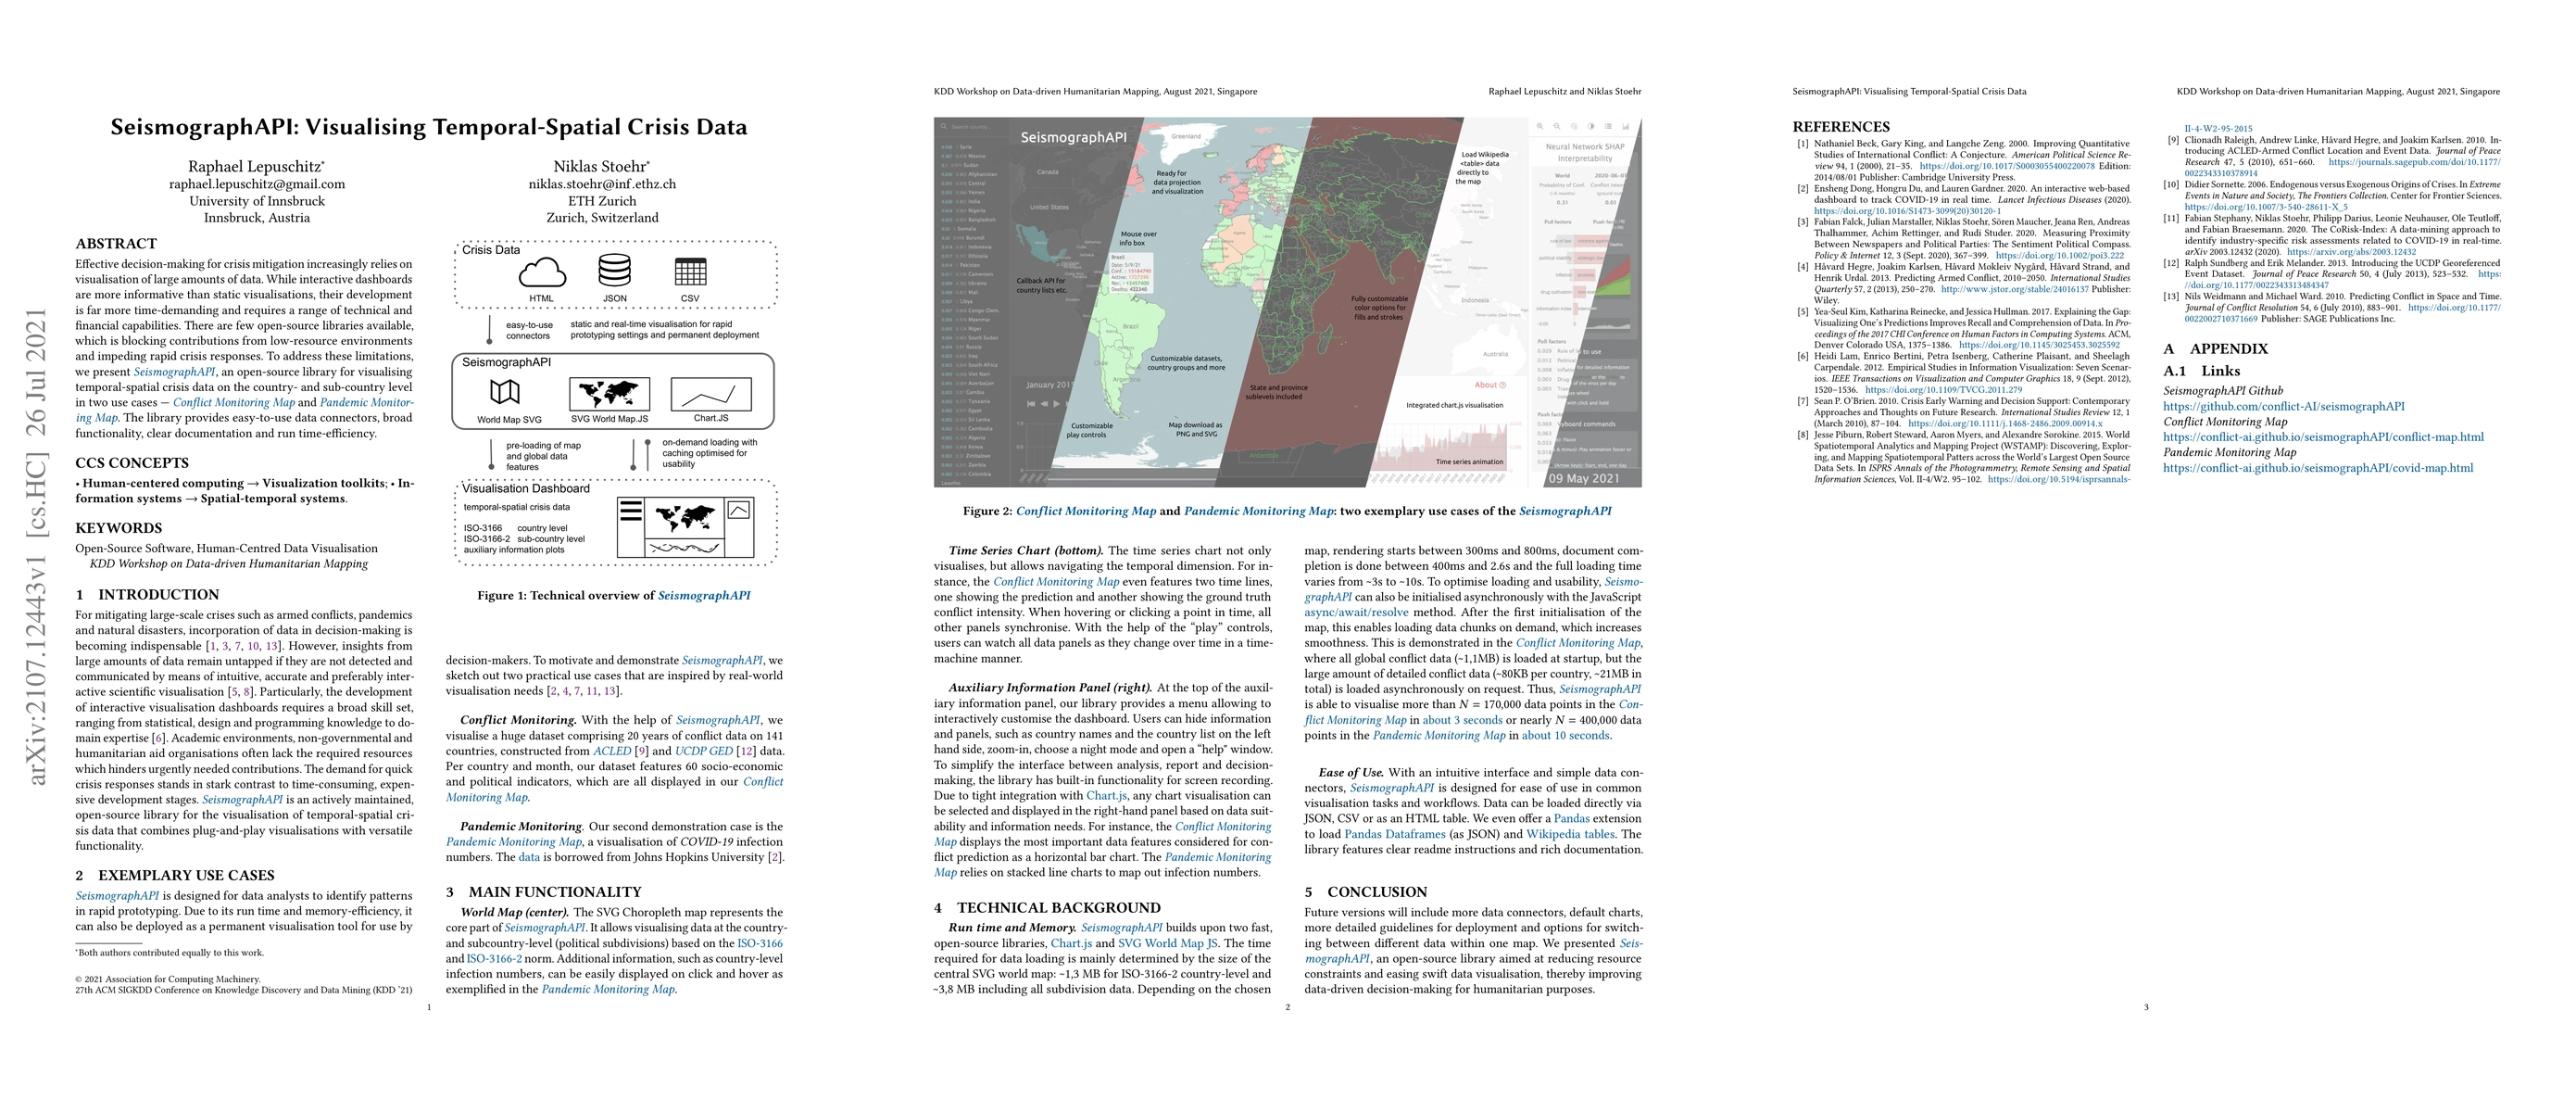
Effective decision-making for crisis mitigation increasingly relies on visualisation of large amounts of data. While interactive dashboards are more informative than static visualisations, their development is far more time-demanding and requires a range of technical and financial capabilities. There are few open-source libraries available, which is blocking contributions from low-resource environments and impeding rapid crisis responses. To address these limitations, we present SeismographAPI, an open-source library for visualising temporal-spatial crisis data on the country- and sub-country level in two use cases: Conflict Monitoring Map and Pandemic Monitoring Map. The library provides easy-to-use data connectors, broad functionality, clear documentation and run time-efficiency.
AI Key Findings — Failed
Key findings generation failed. Failed to start generation process
Impact
Paper Details
Authors
PDF Preview
Key Terms
Citation Network
Current paper (gray), citations (green), references (blue)
Display is limited for performance on very large graphs.
Discussion 0