Publication
Metrics
AI Quick Summary
This paper proposes a framework for generating small, informative sub-tables from large data tables to aid in data exploration. It uses an efficient algorithm based on cell coverage and diversity to select rows and columns, employing table embedding to account for association rules without exhaustive computation.
Paper Preview
Abstract
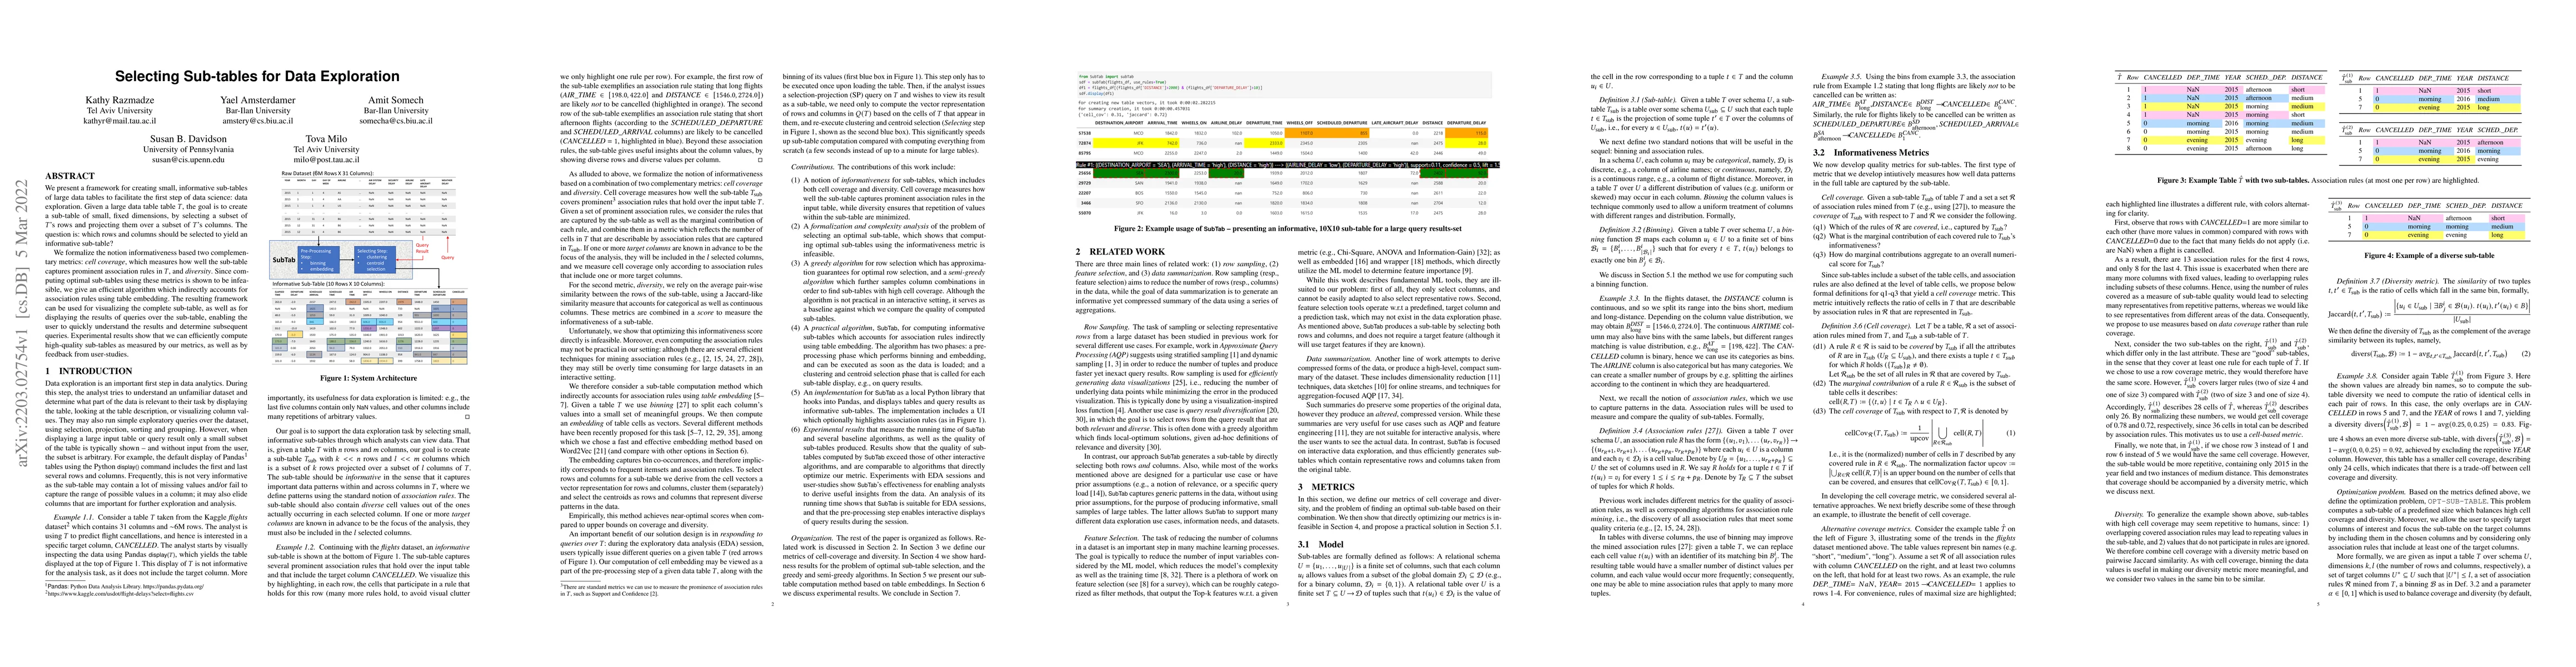
We present a framework for creating small, informative sub-tables of large data tables to facilitate the first step of data science: data exploration. Given a large data table table T, the goal is to create a sub-table of small, fixed dimensions, by selecting a subset of T's rows and projecting them over a subset of T's columns. The question is: which rows and columns should be selected to yield an informative sub-table? We formalize the notion of "informativeness" based on two complementary metrics: cell coverage, which measures how well the sub-table captures prominent association rules in T, and diversity. Since computing optimal sub-tables using these metrics is shown to be infeasible, we give an efficient algorithm which indirectly accounts for association rules using table embedding. The resulting framework can be used for visualizing the complete sub-table, as well as for displaying the results of queries over the sub-table, enabling the user to quickly understand the results and determine subsequent queries. Experimental results show that we can efficiently compute high-quality sub-tables as measured by our metrics, as well as by feedback from user-studies.
AI Key Findings
Get AI-generated insights about this paper's methodology, results, significance, and more — seven facets brought into focus.
Impact
Paper Details
Authors
PDF Preview
Key Terms
Citation Network
Current paper (gray), citations (green), references (blue)
Display is limited for performance on very large graphs.
Discussion 0