Publication
Metrics
AI Quick Summary
Researchers developed a method called dynamic reweighting to correct for selection bias in visualizations of high-dimensional data. It helps users craft unbiased visualizations by applying statistical methods to identify and mitigate bias effects.
Paper Preview
Abstract
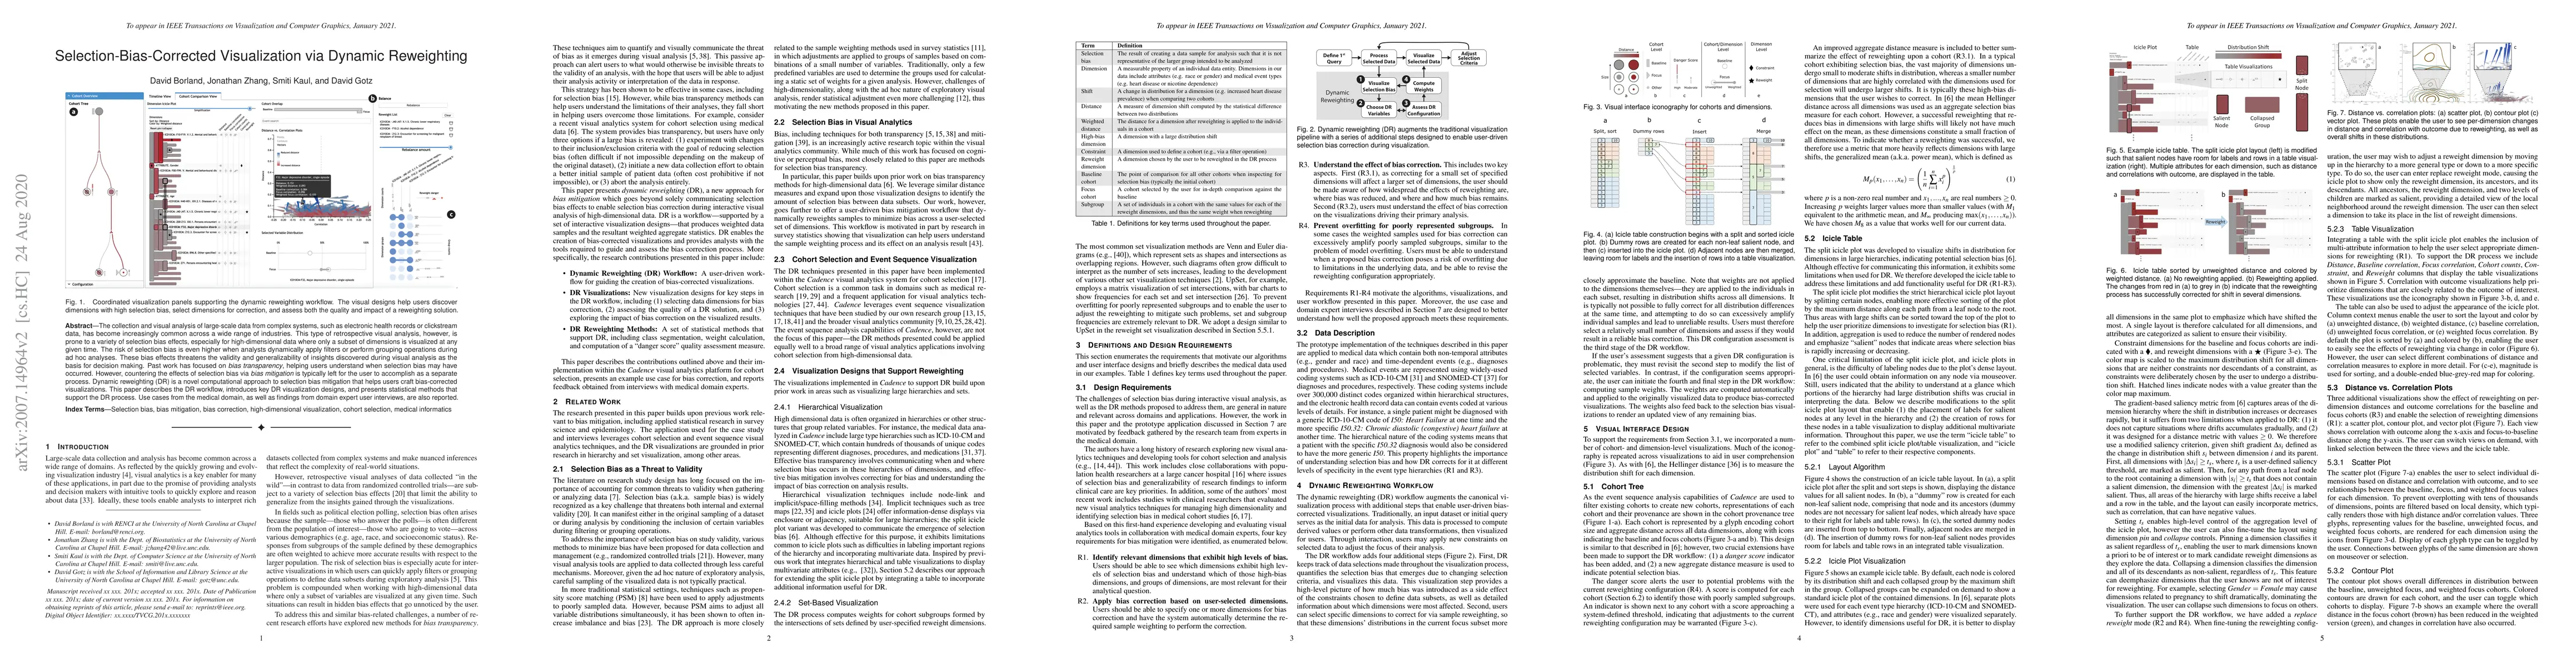
The collection and visual analysis of large-scale data from complex systems, such as electronic health records or clickstream data, has become increasingly common across a wide range of industries. This type of retrospective visual analysis, however, is prone to a variety of selection bias effects, especially for high-dimensional data where only a subset of dimensions is visualized at any given time. The risk of selection bias is even higher when analysts dynamically apply filters or perform grouping operations during ad hoc analyses. These bias effects threatens the validity and generalizability of insights discovered during visual analysis as the basis for decision making. Past work has focused on bias transparency, helping users understand when selection bias may have occurred. However, countering the effects of selection bias via bias mitigation is typically left for the user to accomplish as a separate process. Dynamic reweighting (DR) is a novel computational approach to selection bias mitigation that helps users craft bias-corrected visualizations. This paper describes the DR workflow, introduces key DR visualization designs, and presents statistical methods that support the DR process. Use cases from the medical domain, as well as findings from domain expert user interviews, are also reported.
AI Key Findings
Get AI-generated insights about this paper's methodology, results, significance, and more — seven facets brought into focus.
Impact
Paper Details
Authors
PDF Preview
Key Terms
Citation Network
Current paper (gray), citations (green), references (blue)
Display is limited for performance on very large graphs.
Discussion 0