01
MethodologyHow they did it
Brief description of the research methodology used
This paper proposes semantic network interpretation methods to decode features learned by networks at both filter and decision levels, using probability distributions and textual summarization, supported by a Bayesian inference algorithm, demonstrating its effectiveness through human study and its role in understanding model failure patterns and performance correlations.
Brief description of the research methodology used More in Methodology →
Main finding 1 — Main finding 2 More in Key Results →
Why this research is important and its potential impact More in Significance →
Limitation 1 — Limitation 2 More in Limitations →
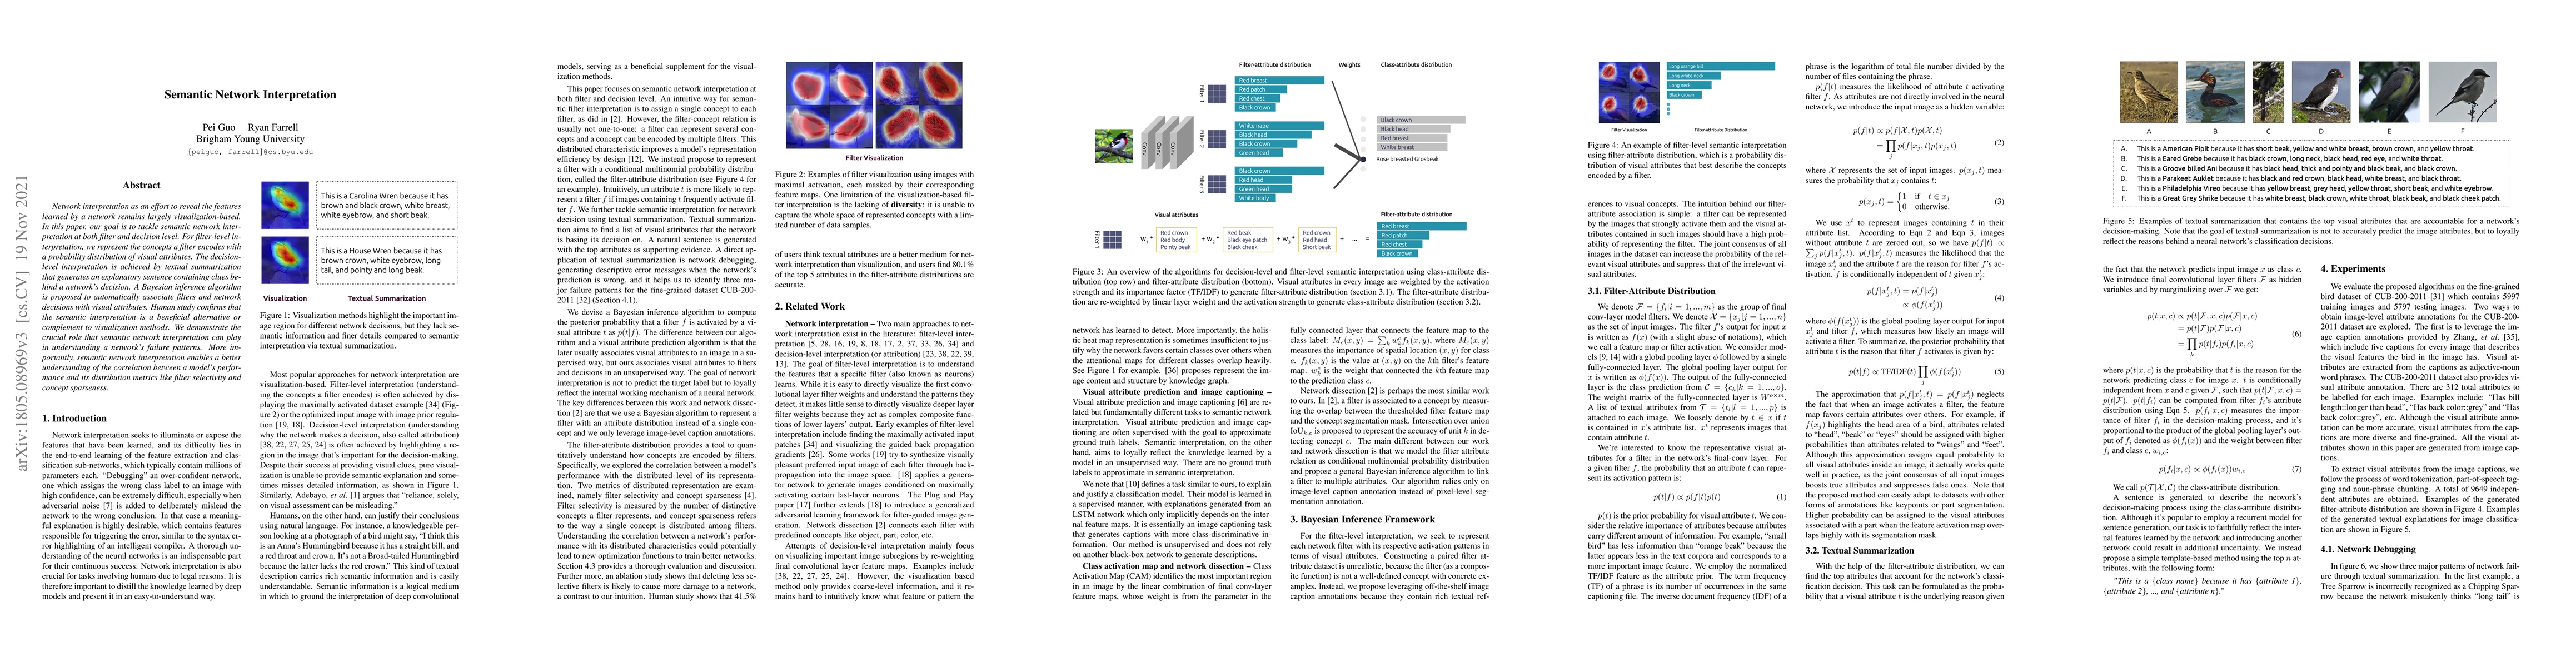
Network interpretation as an effort to reveal the features learned by a network remains largely visualization-based. In this paper, our goal is to tackle semantic network interpretation at both filter and decision level. For filter-level interpretation, we represent the concepts a filter encodes with a probability distribution of visual attributes. The decision-level interpretation is achieved by textual summarization that generates an explanatory sentence containing clues behind a network's decision. A Bayesian inference algorithm is proposed to automatically associate filters and network decisions with visual attributes. Human study confirms that the semantic interpretation is a beneficial alternative or complement to visualization methods. We demonstrate the crucial role that semantic network interpretation can play in understanding a network's failure patterns. More importantly, semantic network interpretation enables a better understanding of the correlation between a model's performance and its distribution metrics like filter selectivity and concept sparseness.
Seven facets of this paper, analysed and brought into focus by AI.
Why this research is important and its potential impact
Brief description of the research methodology used
Why this research is important and its potential impact
Main technical or theoretical contribution
What makes this work novel or different from existing research
Current paper (gray), citations (green), references (blue)
Display is limited for performance on very large graphs.
Discussion 0