Semantic Snapping for Guided Multi-View Visualization Design
Publication
Metrics
AI Quick Summary
This paper introduces semantic snapping, a method to help non-expert users design effective multi-view visualizations by aligning existing views based on their visual encoding. It provides guidance to avoid common pitfalls in visualization design.
Paper Preview
Abstract
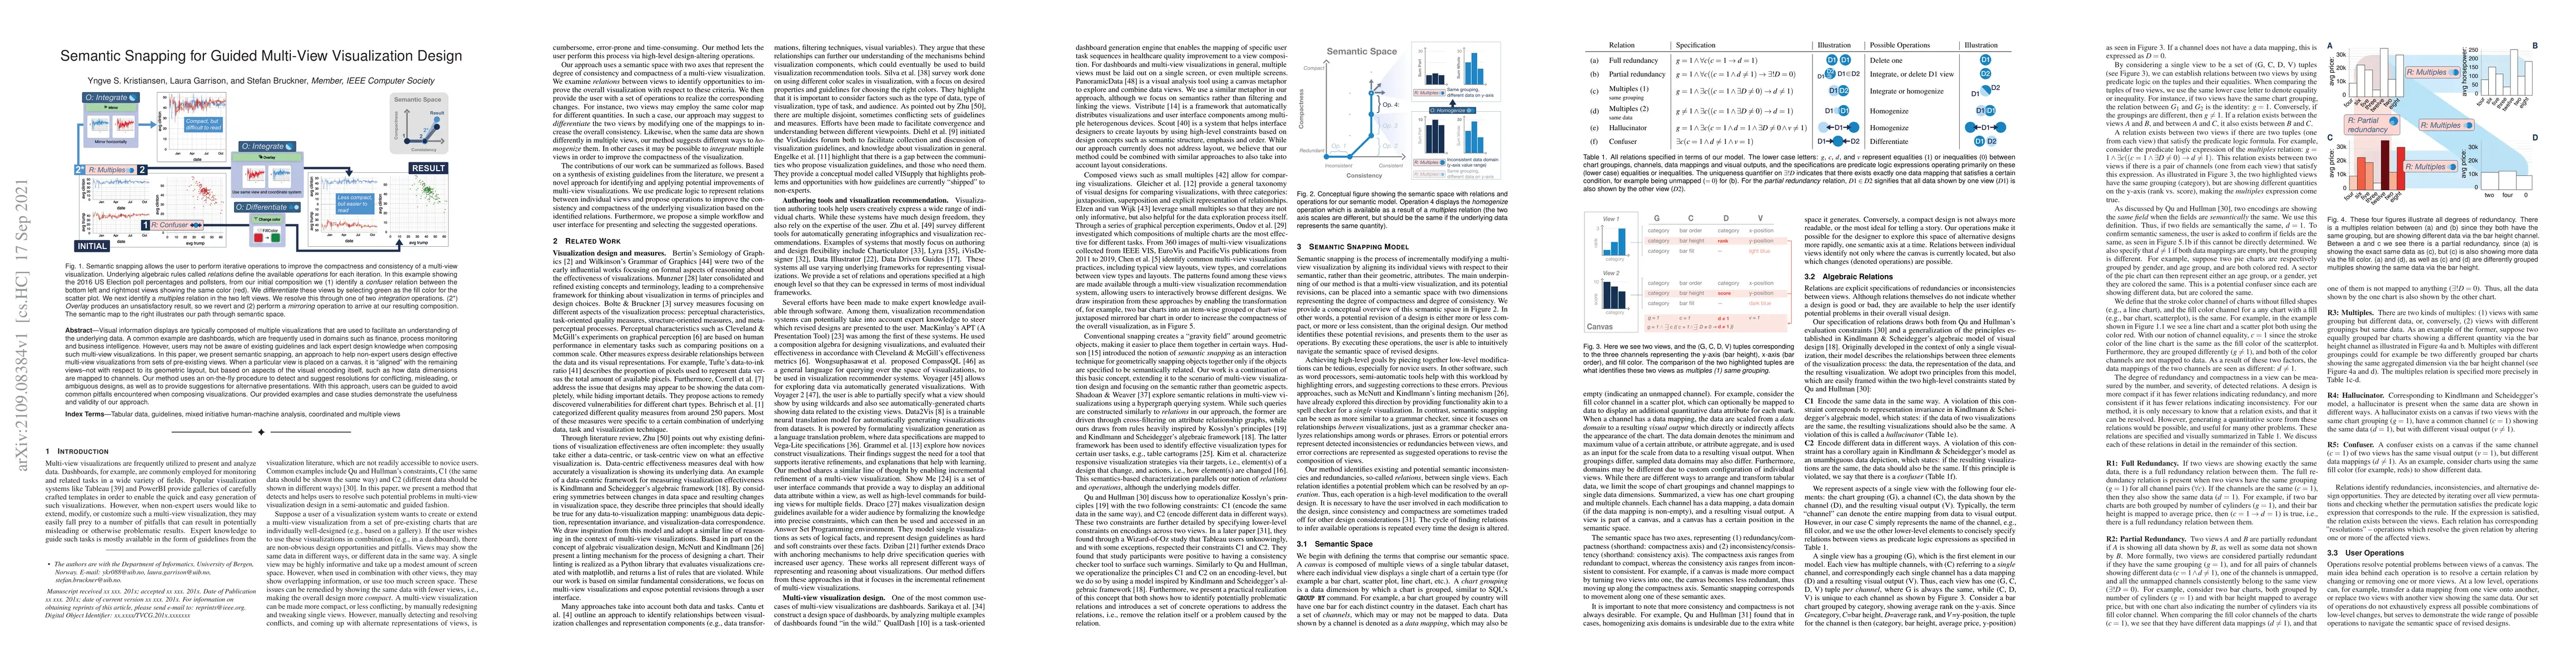
Visual information displays are typically composed of multiple visualizations that are used to facilitate an understanding of the underlying data. A common example are dashboards, which are frequently used in domains such as finance, process monitoring and business intelligence. However, users may not be aware of existing guidelines and lack expert design knowledge when composing such multi-view visualizations. In this paper, we present semantic snapping, an approach to help non-expert users design effective multi-view visualizations from sets of pre-existing views. When a particular view is placed on a canvas, it is "aligned" with the remaining views -- not with respect to its geometric layout, but based on aspects of the visual encoding itself, such as how data dimensions are mapped to channels. Our method uses an on-the-fly procedure to detect and suggest resolutions for conflicting, misleading, or ambiguous designs, as well as to provide suggestions for alternative presentations. With this approach, users can be guided to avoid common pitfalls encountered when composing visualizations. Our provided examples and case studies demonstrate the usefulness and validity of our approach.
AI Key Findings
Get AI-generated insights about this paper's methodology, results, significance, and more — seven facets brought into focus.
Impact
Paper Details
Authors
PDF Preview
Key Terms
Citation Network
Current paper (gray), citations (green), references (blue)
Display is limited for performance on very large graphs.
Discussion 0