Semi-quantitative diagram about temporal evolution in basic physics learning: a study with engineering students
Publication
Metrics
Paper Preview
Abstract
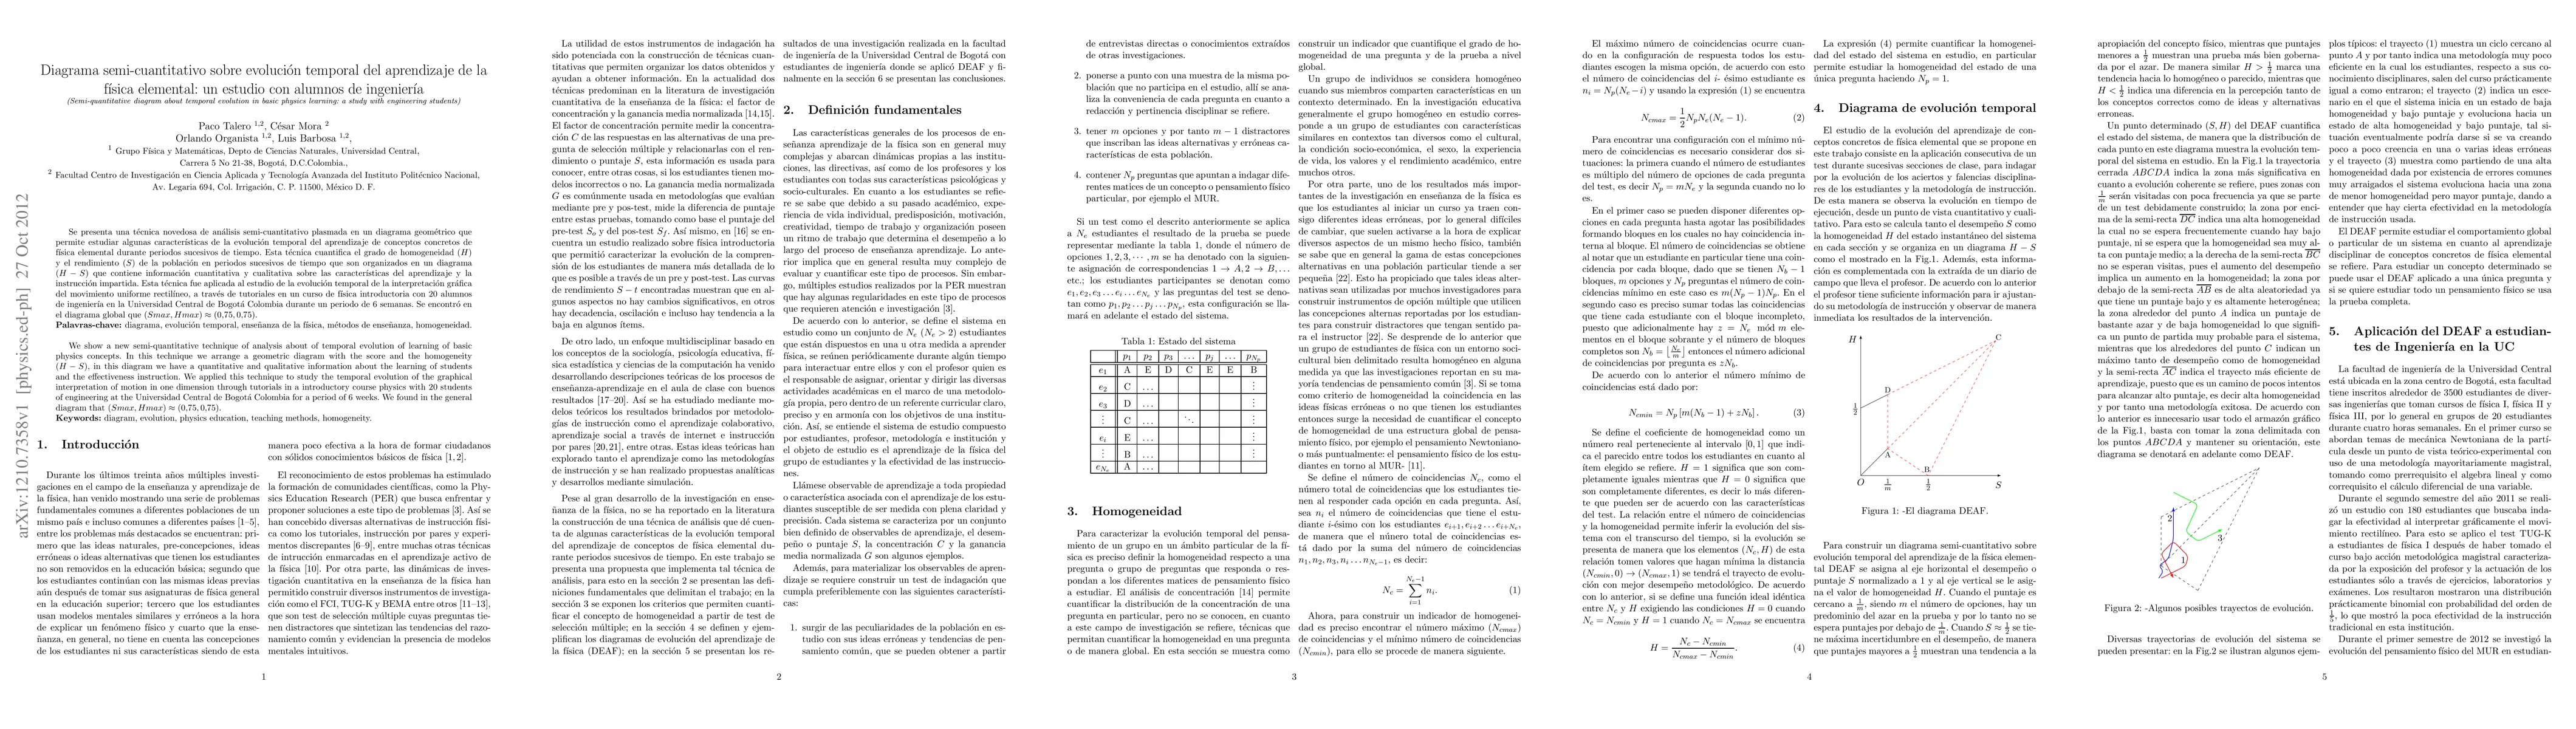
We show a new semi-quantitative technique of analysis about of temporal evolution of learning of basic physics concepts. In this technique we arrange a geometric diagram with the score and the homogeneity (H-S), in this diagram we have a quantitative and qualitative information about the learning of students and the effectiveness instruction. We applied this technique to study the temporal evolution of the graphical interpretation of motion in one dimension through tutorials in a introductory course physics with 20 students of engineering at the Universidad Central de Bogot\'a Colombia for a period of 6 weeks. We found in the general diagram that (Smax,Hmax)=(0.75,0.75).
AI Key Findings
Get AI-generated insights about this paper's methodology, results, significance, and more — seven facets brought into focus.
Impact
Paper Details
PDF Preview
Key Terms
Citation Network
Current paper (gray), citations (green), references (blue)
Display is limited for performance on very large graphs.
Discussion 0