Semi-supervised Data Representation via Affinity Graph Learning
Publication
Metrics
AI Quick Summary
This paper proposes a semi-supervised learning framework that combines manifold regularization with unsupervised data representation techniques like Non-negative matrix factorization and sparse coding to enhance data representation using both labeled and unlabeled data. The framework utilizes an affinity graph to form a Laplacian regularizer, which smooths the low-dimensional data representation while leveraging label information, leading to improved performance compared to state-of-the-art methods.
Paper Preview
Abstract
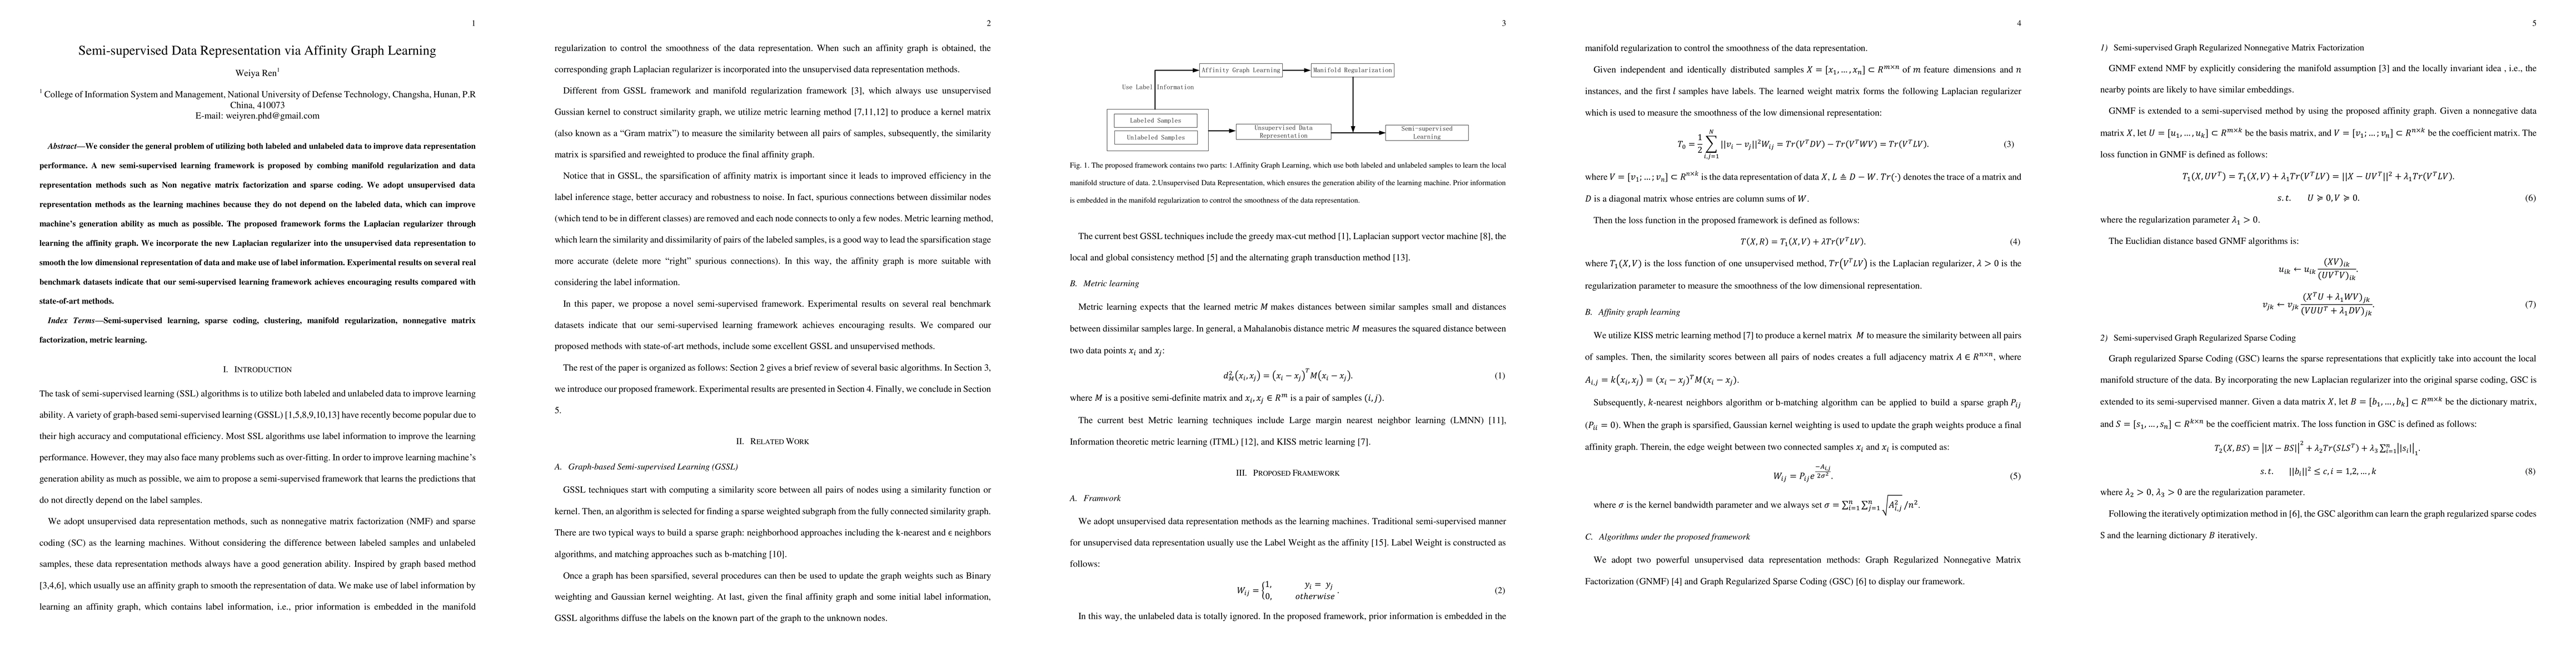
We consider the general problem of utilizing both labeled and unlabeled data to improve data representation performance. A new semi-supervised learning framework is proposed by combing manifold regularization and data representation methods such as Non negative matrix factorization and sparse coding. We adopt unsupervised data representation methods as the learning machines because they do not depend on the labeled data, which can improve machine's generation ability as much as possible. The proposed framework forms the Laplacian regularizer through learning the affinity graph. We incorporate the new Laplacian regularizer into the unsupervised data representation to smooth the low dimensional representation of data and make use of label information. Experimental results on several real benchmark datasets indicate that our semi-supervised learning framework achieves encouraging results compared with state-of-art methods.
AI Key Findings
Get AI-generated insights about this paper's methodology, results, significance, and more — seven facets brought into focus.
Impact
Paper Details
PDF Preview
Key Terms
Citation Network
Current paper (gray), citations (green), references (blue)
Display is limited for performance on very large graphs.
Discussion 0