Publication
Metrics
AI Quick Summary
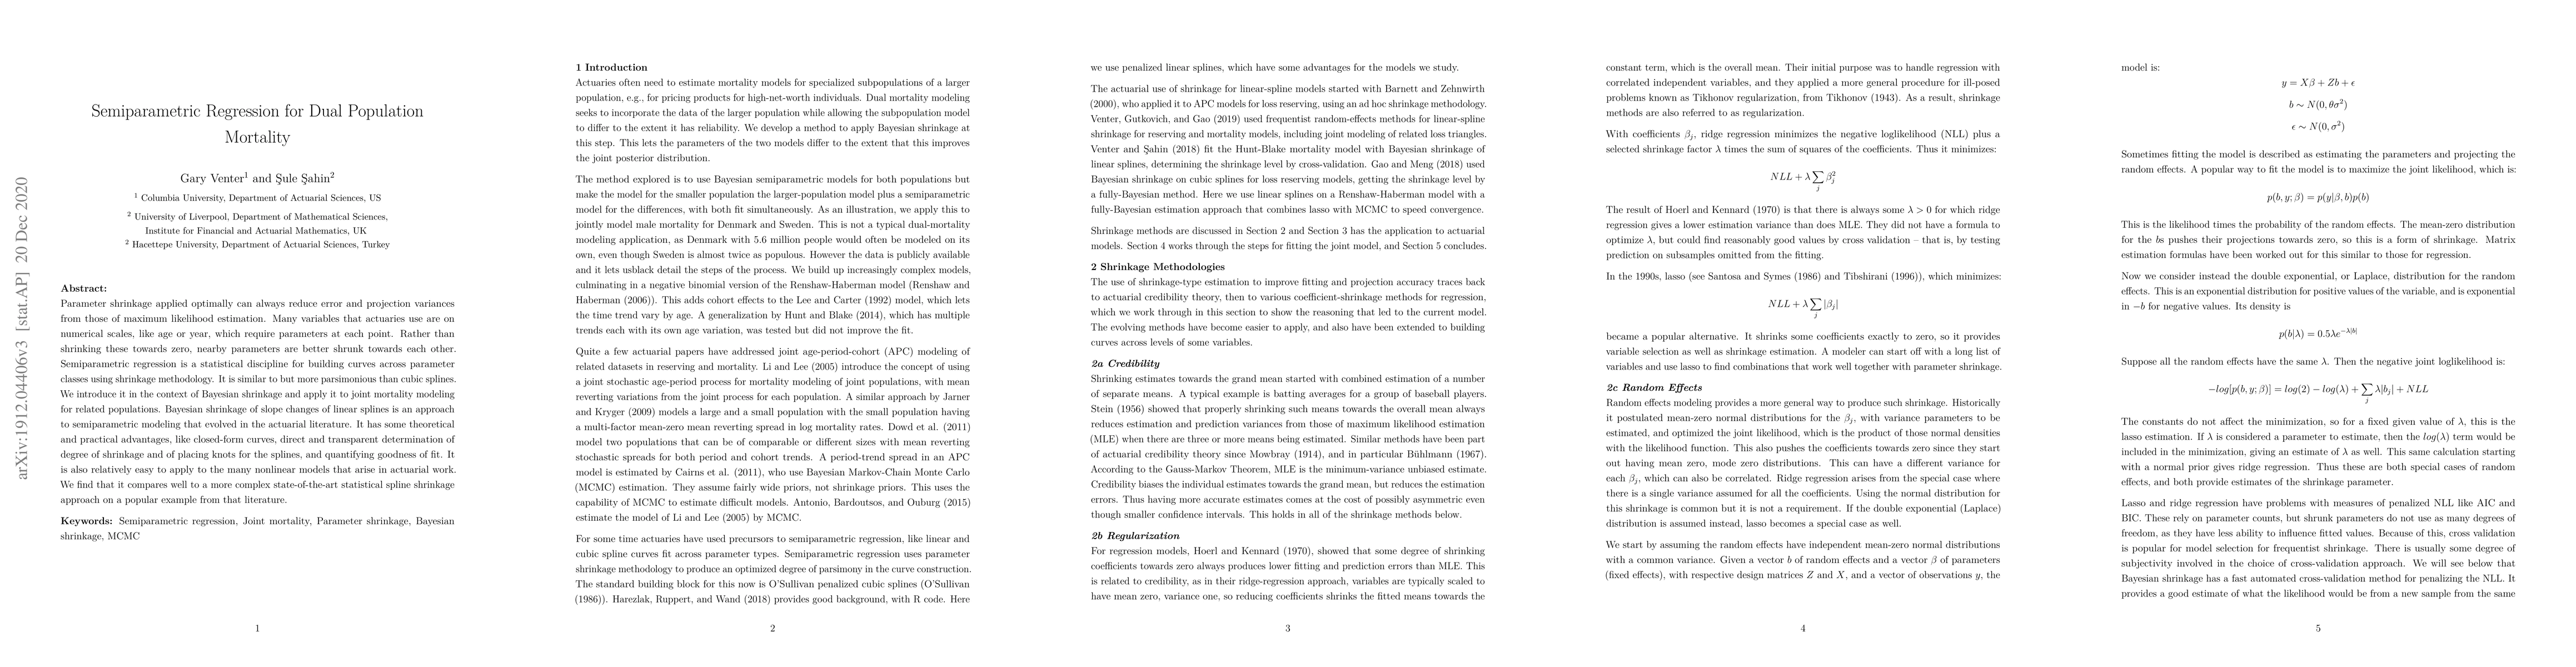
This paper introduces semiparametric regression for dual population mortality modeling, emphasizing Bayesian shrinkage techniques that shrink parameters towards each other rather than towards zero. The method is shown to compare favorably to more complex spline shrinkage approaches in terms of error reduction and model fit.
Paper Preview
Abstract
Parameter shrinkage applied optimally can always reduce error and projection variances from those of maximum likelihood estimation. Many variables that actuaries use are on numerical scales, like age or year, which require parameters at each point. Rather than shrinking these towards zero, nearby parameters are better shrunk towards each other. Semiparametric regression is a statistical discipline for building curves across parameter classes using shrinkage methodology. It is similar to but more parsimonious than cubic splines. We introduce it in the context of Bayesian shrinkage and apply it to joint mortality modeling for related populations. Bayesian shrinkage of slope changes of linear splines is an approach to semiparametric modeling that evolved in the actuarial literature. It has some theoretical and practical advantages, like closed-form curves, direct and transparent determination of degree of shrinkage and of placing knots for the splines, and quantifying goodness of fit. It is also relatively easy to apply to the many nonlinear models that arise in actuarial work. We find that it compares well to a more complex state-of-the-art statistical spline shrinkage approach on a popular example from that literature.
AI Key Findings
Get AI-generated insights about this paper's methodology, results, significance, and more — seven facets brought into focus.
Impact
Paper Details
Authors
PDF Preview
Key Terms
Citation Network
Current paper (gray), citations (green), references (blue)
Display is limited for performance on very large graphs.
Discussion 0