Seven proofs of the Pearson Chi-squared independence test and its graphical interpretation
Publication
Metrics
AI Quick Summary
This paper provides seven proofs of the Pearson Chi-squared independence test and introduces a new graphical interpretation that visually aids in understanding and assessing the test's results, facilitating intuitive decision-making on the null hypothesis of non-independence.
Paper Preview
Abstract
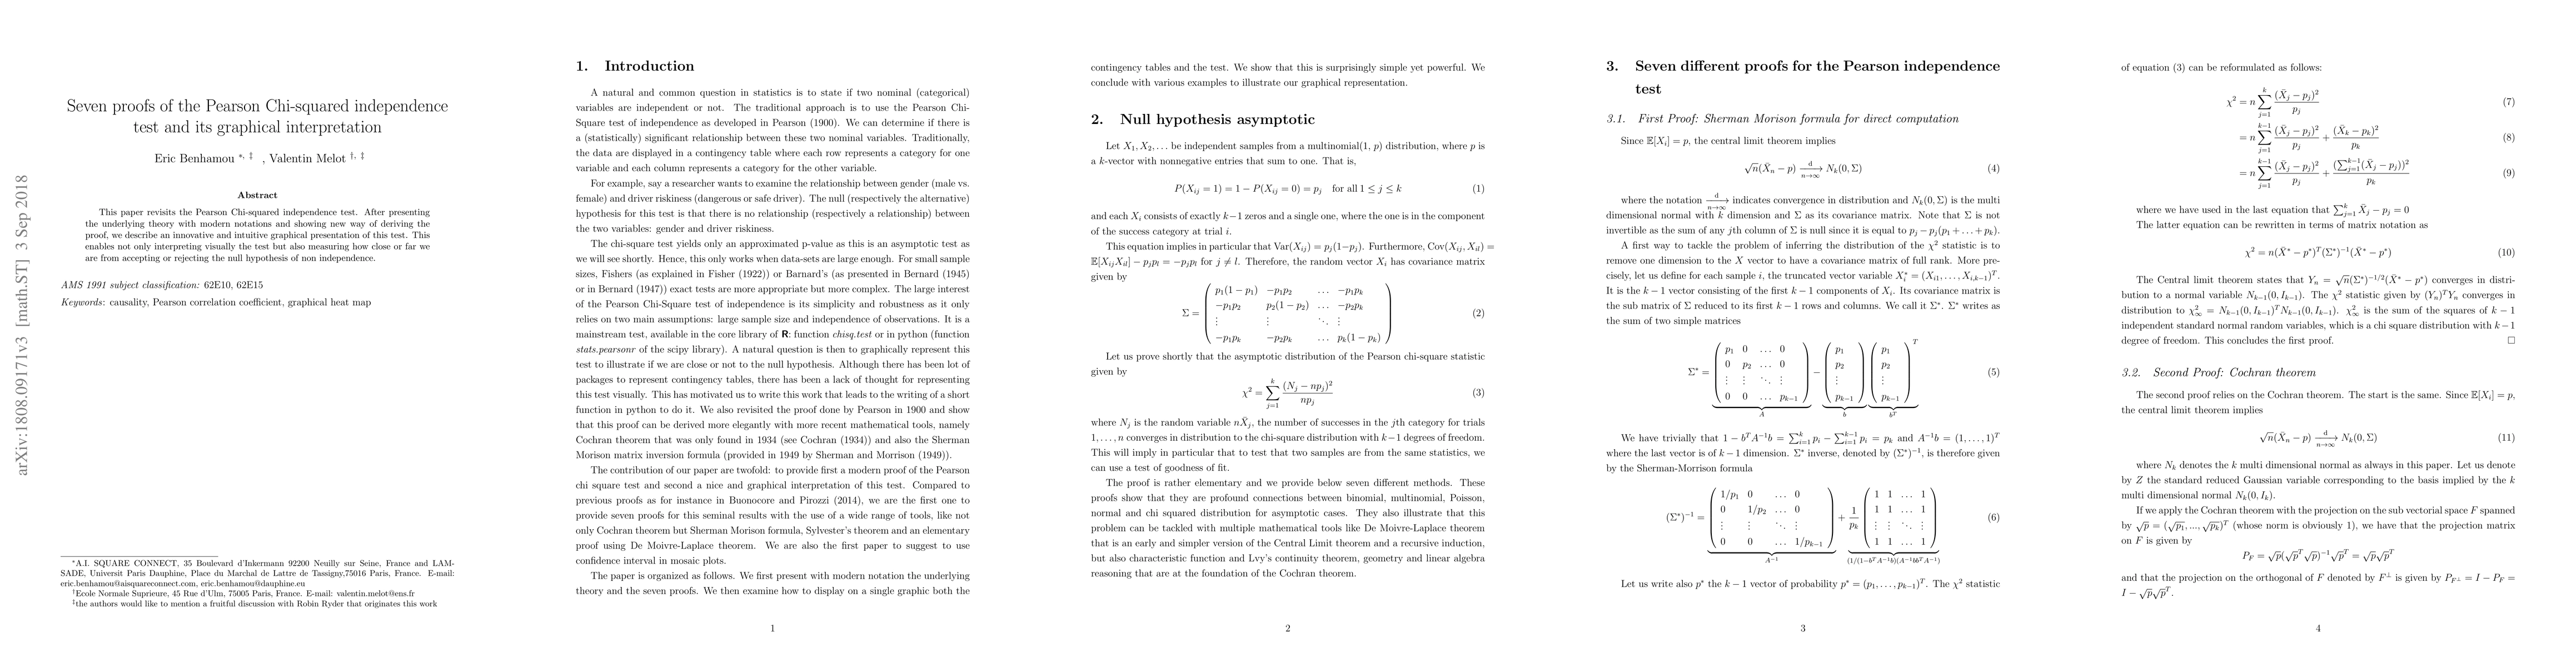
This paper revisits the Pearson Chi-squared independence test. After presenting the underlying theory with modern notations and showing new way of deriving the proof, we describe an innovative and intuitive graphical presentation of this test. This enables not only interpreting visually the test but also measuring how close or far we are from accepting or rejecting the null hypothesis of non independence
AI Key Findings
Get AI-generated insights about this paper's methodology, results, significance, and more — seven facets brought into focus.
Impact
Paper Details
PDF Preview
Key Terms
Citation Network
Current paper (gray), citations (green), references (blue)
Display is limited for performance on very large graphs.
Discussion 0