Publication
Metrics
Paper Preview
Abstract
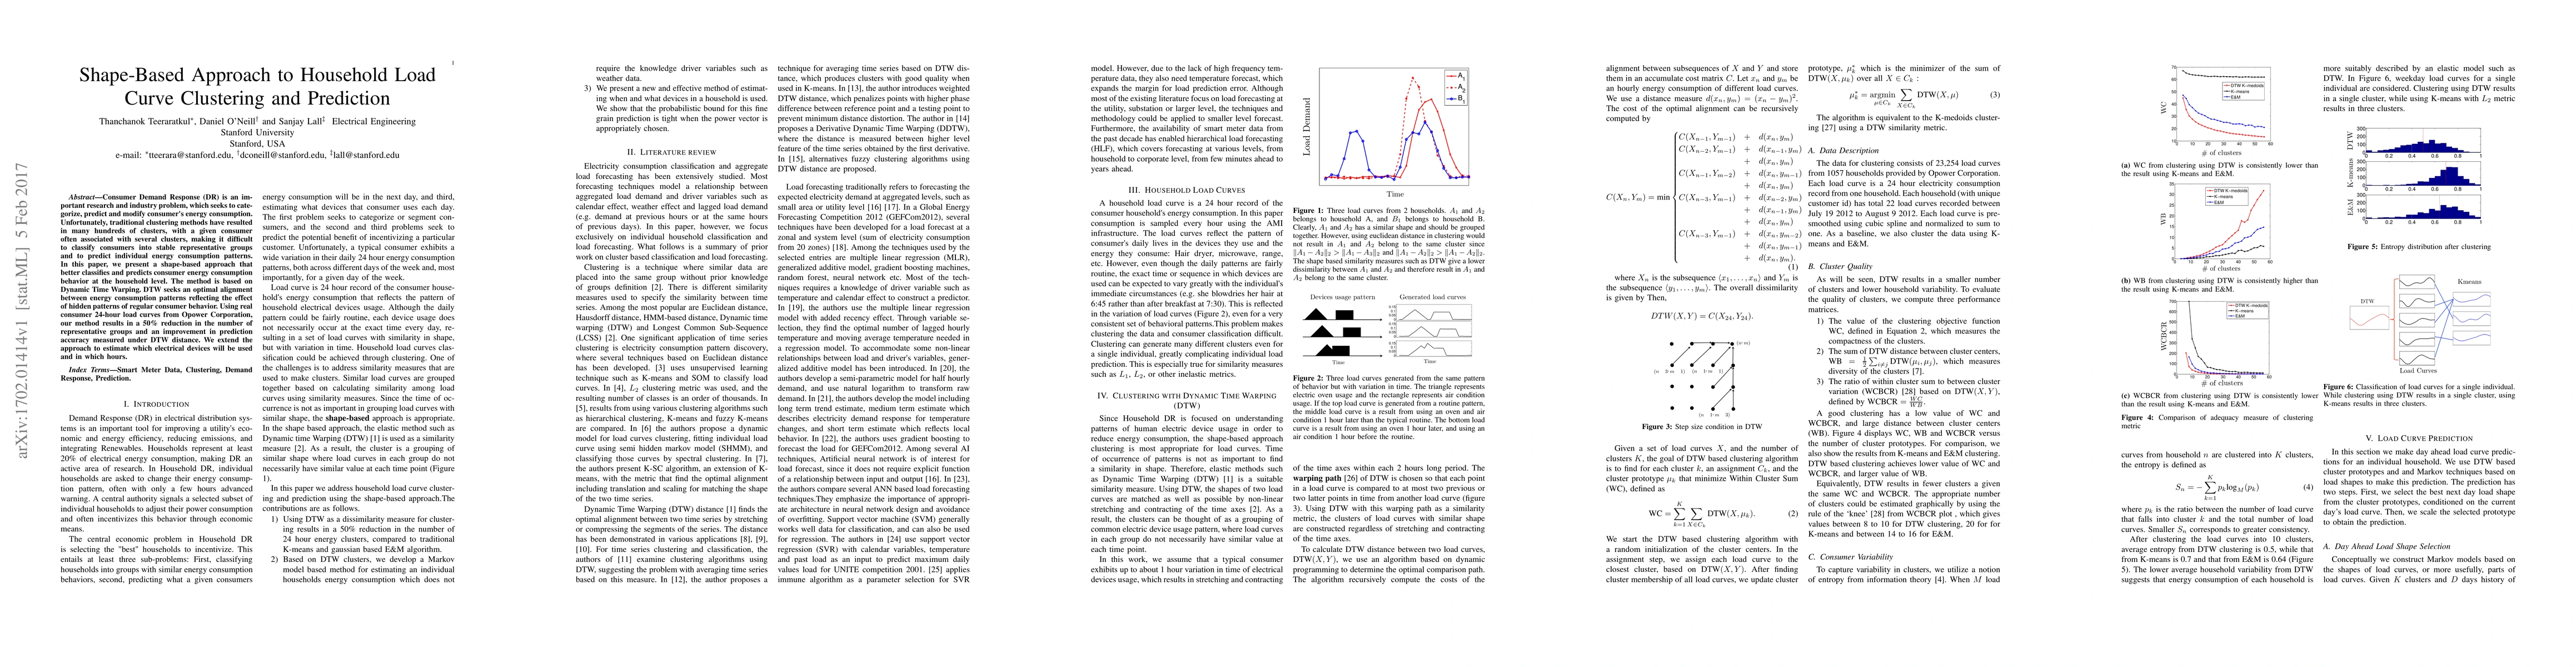
Consumer Demand Response (DR) is an important research and industry problem, which seeks to categorize, predict and modify consumer's energy consumption. Unfortunately, traditional clustering methods have resulted in many hundreds of clusters, with a given consumer often associated with several clusters, making it difficult to classify consumers into stable representative groups and to predict individual energy consumption patterns. In this paper, we present a shape-based approach that better classifies and predicts consumer energy consumption behavior at the household level. The method is based on Dynamic Time Warping. DTW seeks an optimal alignment between energy consumption patterns reflecting the effect of hidden patterns of regular consumer behavior. Using real consumer 24-hour load curves from Opower Corporation, our method results in a 50% reduction in the number of representative groups and an improvement in prediction accuracy measured under DTW distance. We extend the approach to estimate which electrical devices will be used and in which hours.
AI Key Findings
Get AI-generated insights about this paper's methodology, results, significance, and more — seven facets brought into focus.
Impact
Paper Details
PDF Preview
Key Terms
Citation Network
Current paper (gray), citations (green), references (blue)
Display is limited for performance on very large graphs.
Discussion 0