Shaping Plant-Like Shape-Changing Interfaces as Vertical Charts: Maximizing Readability, Aesthetics, and Naturalness
Publication
Metrics
Paper Preview
Abstract
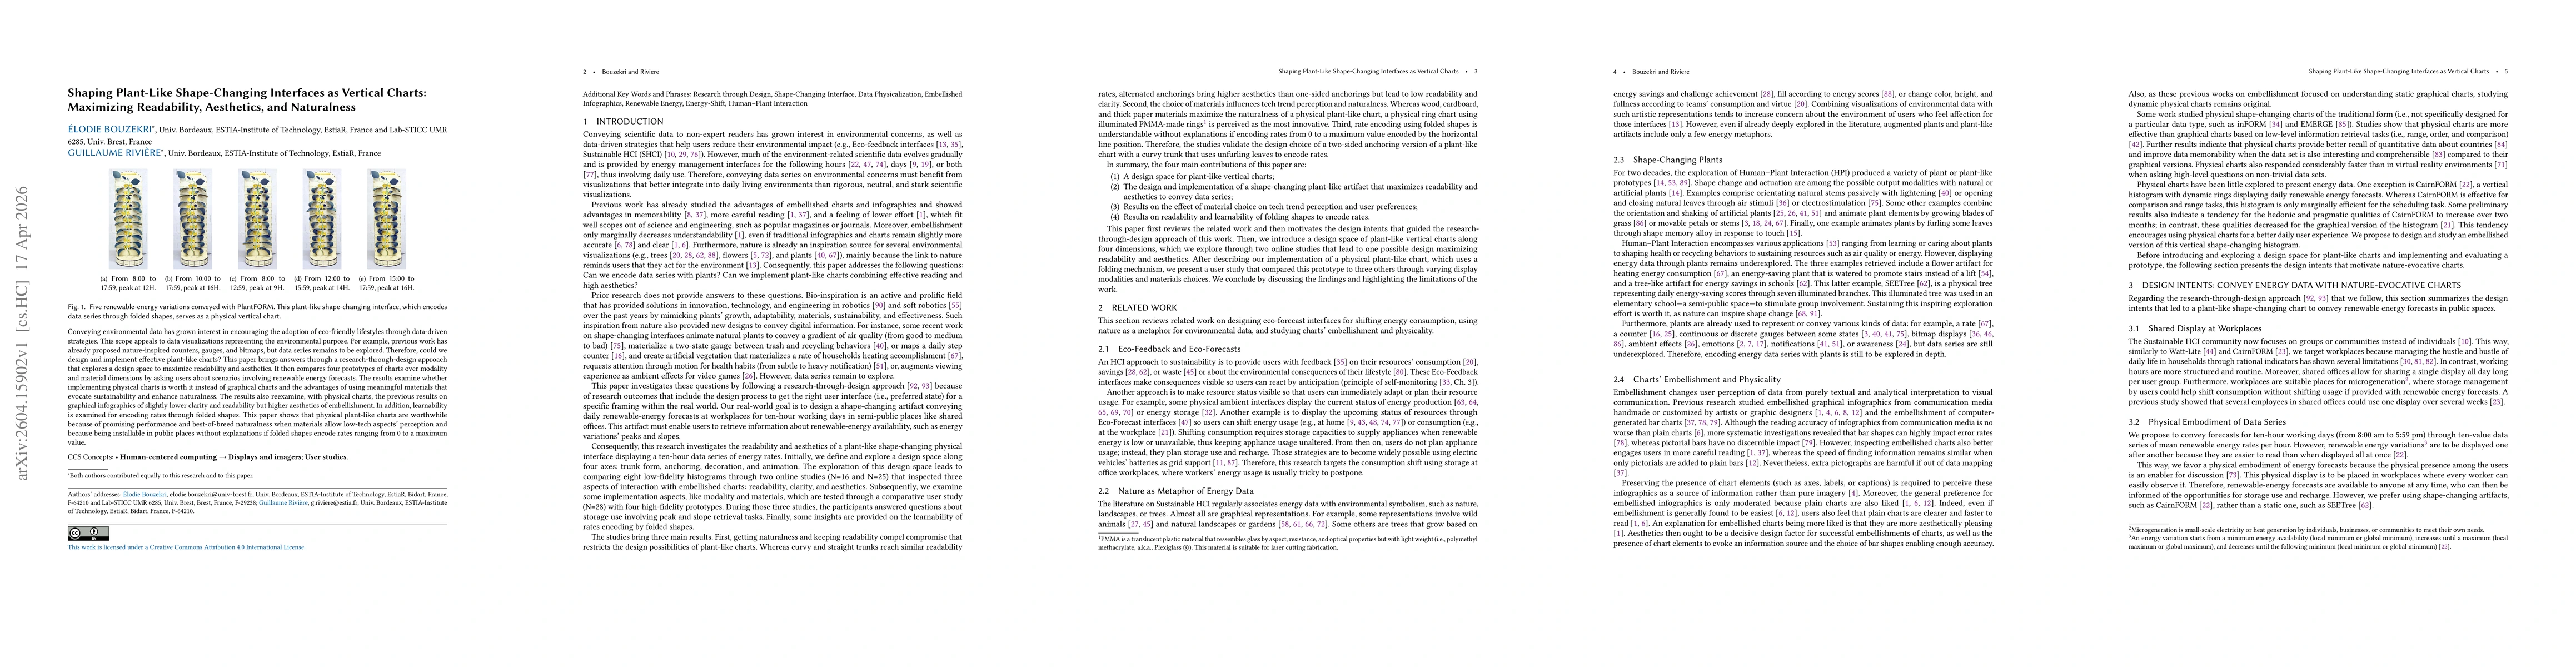
Conveying environmental data has grown interest in encouraging the adoption of eco-friendly lifestyles through data-driven strategies. This scope appeals to data visualizations representing the environmental purpose. For example, previous work has already proposed nature-inspired counters, gauges, and bitmaps, but data series remains to be explored. Therefore, could we design and implement effective plant-like charts? This paper brings answers through a research-through-design approach that explores a design space to maximize readability and aesthetics. It then compares four prototypes of charts over modality and material dimensions by asking users about scenarios involving renewable energy forecasts. The results examine whether implementing physical charts is worth it instead of graphical charts and the advantages of using meaningful materials that evocate sustainability and enhance naturalness. The results also reexamine, with physical charts, the previous results on graphical infographics of slightly lower clarity and readability but higher aesthetics of embellishment. In addition, learnability is examined for encoding rates through folded shapes. This paper shows that physical plant-like charts are worthwhile because of promising performance and best-of-breed naturalness when materials allow low-tech aspects' perception and because being installable in public places without explanations if folded shapes encode rates ranging from 0 to a maximum value.
AI Key Findings
Get AI-generated insights about this paper's methodology, results, significance, and more — seven facets brought into focus.
Discussion 0