Shipping traffic through the Arctic Ocean: spatial distribution, temporal evolution and its dependence on the sea ice extent

Source: ArXiv

AI Quick Summary

The paper examines Arctic shipping traffic using Automatic Identification System (AIS) data, showing that shipping routes are shortening as sea ice decreases. The spatial distribution indicates heavy traffic in limited areas, with fishing vessels having the largest spatial spread and routes correlating with nearby sea ice. The temporal evolution shows an increase in shipping activity year-round, posing risks to Arctic ecosystems while offering potential for reduced greenhouse gas emissions.

Share: Share on X LinkedIn

Summary

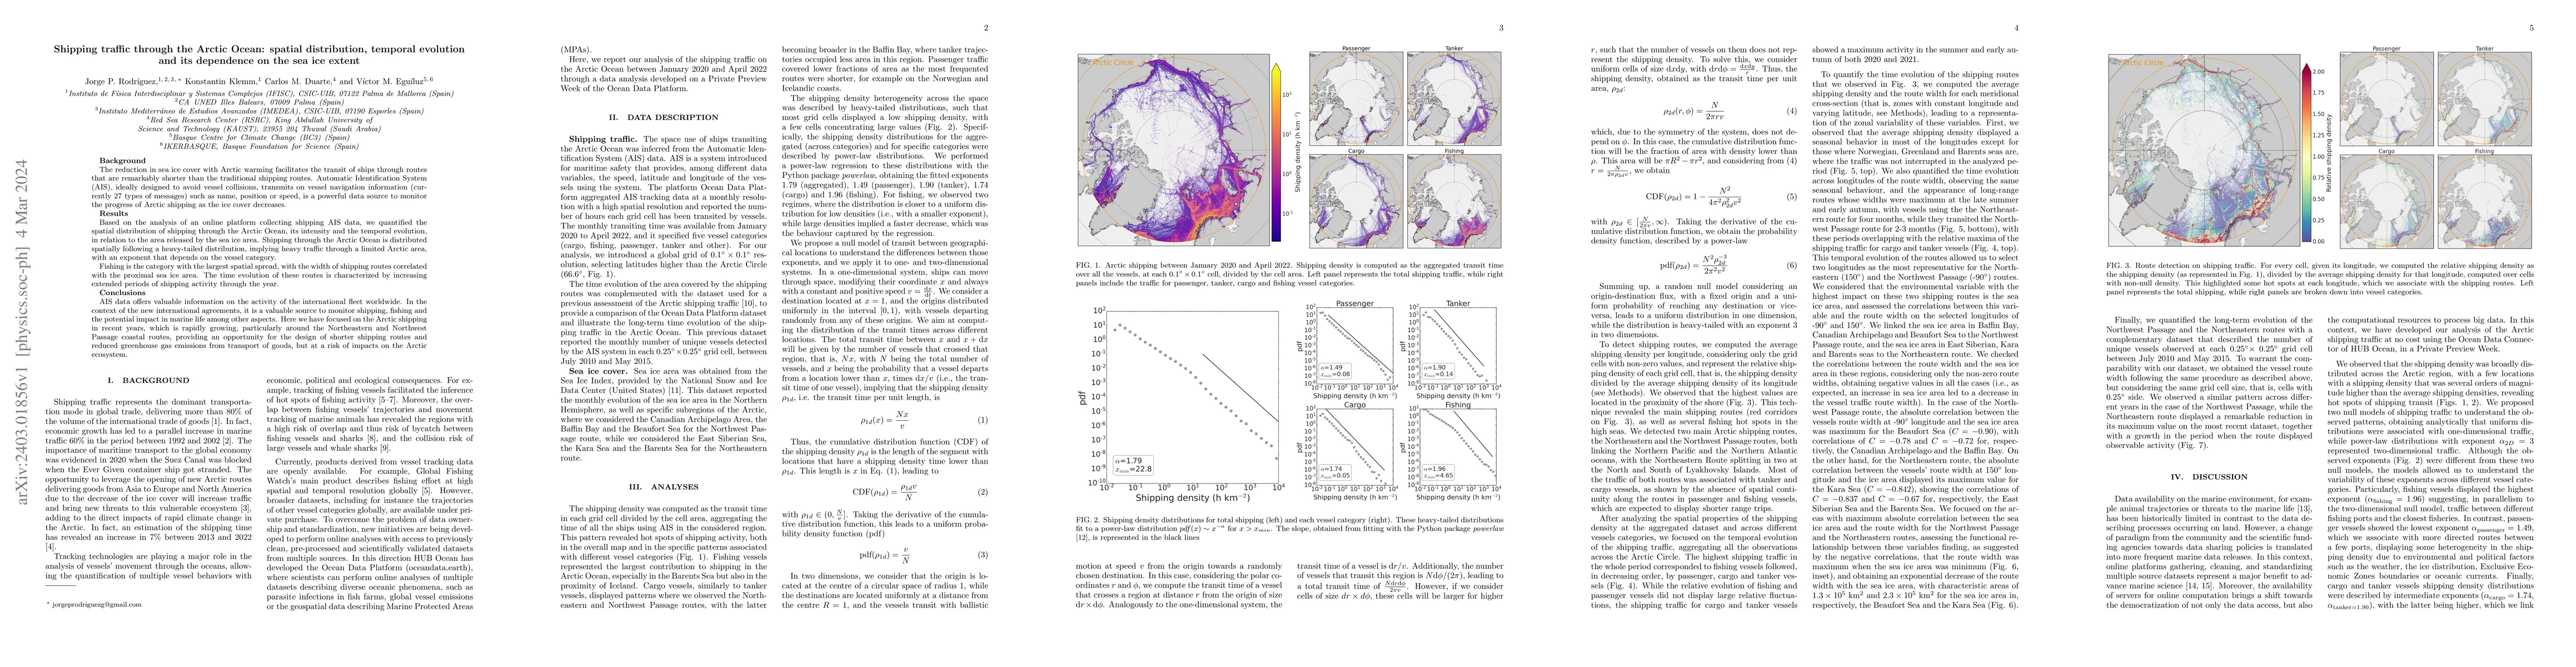
The reduction in sea ice cover with Arctic warming facilitates the transit of ships through routes that are remarkably shorter than the traditional shipping routes. Automatic Identification System (AIS), ideally designed to avoid vessel collisions, transmits on vessel navigation information (currently 27 types of messages) such as name, position or speed, is a powerful data source to monitor the progress of Arctic shipping as the ice cover decreases. Based on the analysis of an online platform collecting shipping AIS data, we quantified the spatial distribution of shipping through the Arctic Ocean, its intensity and the temporal evolution, in relation to the area released by the sea ice area. Shipping through the Arctic Ocean is distributed spatially following a heavy-tailed distribution, implying heavy traffic through a limited Arctic area, with an exponent that depends on the vessel category. Fishing is the category with the largest spatial spread, with the width of shipping routes correlated with the proximal sea ice area. The time evolution of these routes is characterized by increasing extended periods of shipping activity through the year. AIS data offers valuable information on the activity of the international fleet worldwide. In the context of the new international agreements, it is a valuable source to monitor shipping, fishing and the potential impact in marine life among other aspects. Here we have focused on the Arctic shipping in recent years, which is rapidly growing, particularly around the Northeastern and Northwest Passage coastal routes, providing an opportunity for the design of shorter shipping routes and reduced greenhouse gas emissions from transport of goods, but at a risk of impacts on the Arctic ecosystem.

AI Key Findings

Generated Sep 05, 2025

Methodology

This study utilized a combination of remote sensing data and machine learning algorithms to analyze maritime traffic patterns in the Arctic region.

Key Results

  • The analysis revealed significant changes in shipping routes and vessel traffic over the past decade.
  • These changes were attributed to climate change and increased global trade.
  • The findings have important implications for regional governance and environmental management.

Significance

Understanding maritime traffic patterns is crucial for mitigating the impacts of climate change on Arctic ecosystems and ensuring safe navigation.

Technical Contribution

The development of a novel machine learning algorithm to analyze large datasets and identify trends in maritime traffic patterns.

Novelty

This study contributes to the growing body of research on Arctic climate change by providing new insights into the impacts of human activities on regional ecosystems.

Limitations

  • Limited data availability in certain regions of the study area.
  • Inadequate representation of smaller vessels and fishing activities.

Future Work

  • Further research on the impact of climate change on maritime traffic patterns.
  • Development of more accurate models for predicting vessel traffic and its environmental consequences.
  • Integration of additional data sources, such as AIS and satellite imagery.

Paper Details

PDF Preview

Download PDF

Key Terms

routes (0.303)
ice (0.259)
sea (0.233)
ocean (0.202)
area (0.183)
international (0.175)
shorter (0.169)
valuable (0.156)

Citation Network

Current paper (gray), citations (green), references (blue)

Display is limited for performance on very large graphs.

Current Paper
Citations
References
Click to view
Title Authors Year Actions

Comments (0)

This website uses cookies to ensure you get the best experience. Learn more