Should Observations be Grouped for Effective Monitoring of Multivariate Process Variability?
Publication
Metrics
AI Quick Summary
This paper compares the performance of multivariate dispersion control charts for monitoring process variability, finding that charts based on individual observations detect shifts faster than those using grouped observations. It recommends overlapping subgroups for subgroup data monitoring and investigates the effect of subgroup size, concluding with a simulation study and case study.
Paper Preview
Abstract
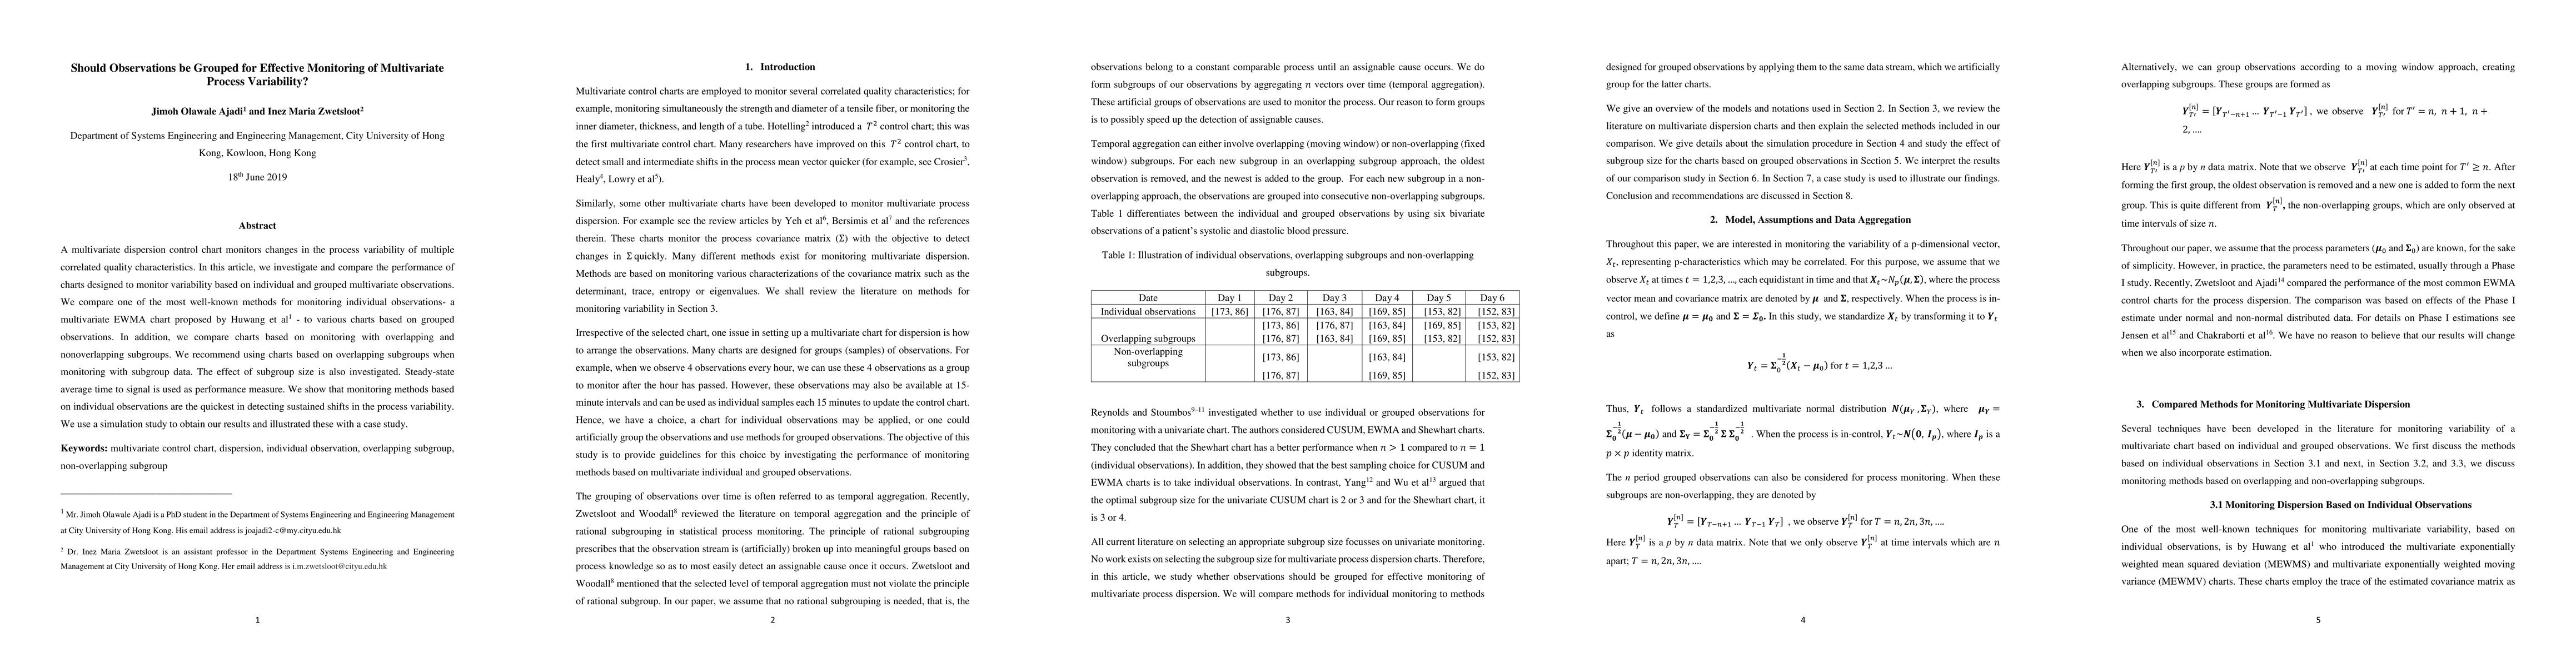
A multivariate dispersion control chart monitors changes in the process variability of multiple correlated quality characteristics. In this article, we investigate and compare the performance of charts designed to monitor variability based on individual and grouped multivariate observations. We compare one of the most well-known methods for monitoring individual observations -- a multivariate EWMA chart proposed by Huwang et al -- to various charts based on grouped observations. In addition, we compare charts based on monitoring with overlapping and nonoverlapping subgroups. We recommend using charts based on overlapping subgroups when monitoring with subgroup data. The effect of subgroup size is also investigated. Steady-state average time to signal is used as performance measure. We show that monitoring methods based on individual observations are the quickest in detecting sustained shifts in the process variability. We use a simulation study to obtain our results and illustrated these with a case study.
AI Key Findings
Get AI-generated insights about this paper's methodology, results, significance, and more — seven facets brought into focus.
Impact
Paper Details
PDF Preview
Key Terms
Citation Network
Current paper (gray), citations (green), references (blue)
Display is limited for performance on very large graphs.
Discussion 0