Sickle Cell Disease Severity Prediction from Percoll Gradient Images using Graph Convolutional Networks
Publication
Metrics
AI Quick Summary
A new approach using a graph convolutional network predicts Sickle Cell Disease severity from Percoll gradient images with high performance, offering a potential solution for patients in underdeveloped countries with limited access to medical instruments and doctors.
Paper Preview
Abstract
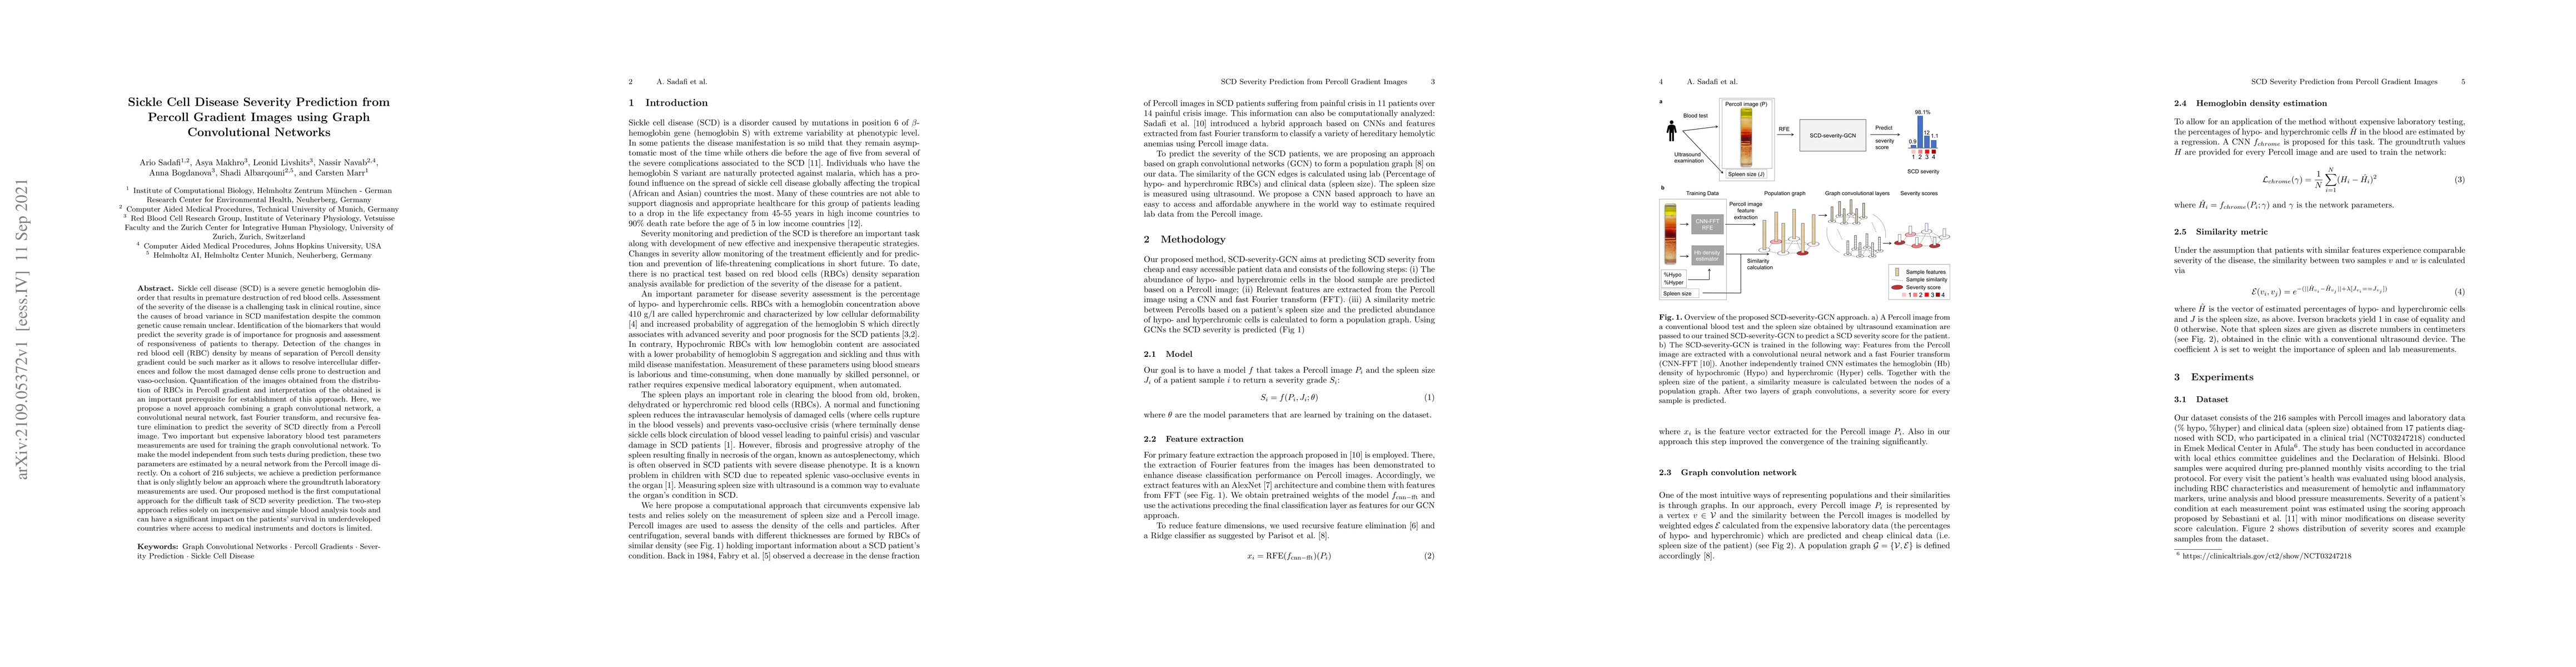
Sickle cell disease (SCD) is a severe genetic hemoglobin disorder that results in premature destruction of red blood cells. Assessment of the severity of the disease is a challenging task in clinical routine since the causes of broad variance in SCD manifestation despite the common genetic cause remain unclear. Identification of the biomarkers that would predict the severity grade is of importance for prognosis and assessment of responsiveness of patients to therapy. Detection of the changes in red blood cell (RBC) density through separation of Percoll density gradient could be such marker as it allows to resolve intercellular differences and follow the most damaged dense cells prone to destruction and vaso-occlusion. Quantification of the images obtained from the distribution of RBCs in Percoll gradient and interpretation of the obtained is an important prerequisite for establishment of this approach. Here, we propose a novel approach combining a graph convolutional network, a convolutional neural network, fast Fourier transform, and recursive feature elimination to predict the severity of SCD directly from a Percoll image. Two important but expensive laboratory blood test parameters measurements are used for training the graph convolutional network. To make the model independent from such tests during prediction, the two parameters are estimated by a neural network from the Percoll image directly. On a cohort of 216 subjects, we achieve a prediction performance that is only slightly below an approach where the groundtruth laboratory measurements are used. Our proposed method is the first computational approach for the difficult task of SCD severity prediction. The two-step approach relies solely on inexpensive and simple blood analysis tools and can have a significant impact on the patients' survival in underdeveloped countries where access to medical instruments and doctors is limited
AI Key Findings
Get AI-generated insights about this paper's methodology, results, significance, and more — seven facets brought into focus.
Impact
Paper Details
Authors
PDF Preview
Key Terms
Citation Network
Current paper (gray), citations (green), references (blue)
Display is limited for performance on very large graphs.
Discussion 0