Signal Processing on Graphs: Causal Modeling of Unstructured Data
Publication
Metrics
Paper Preview
Abstract
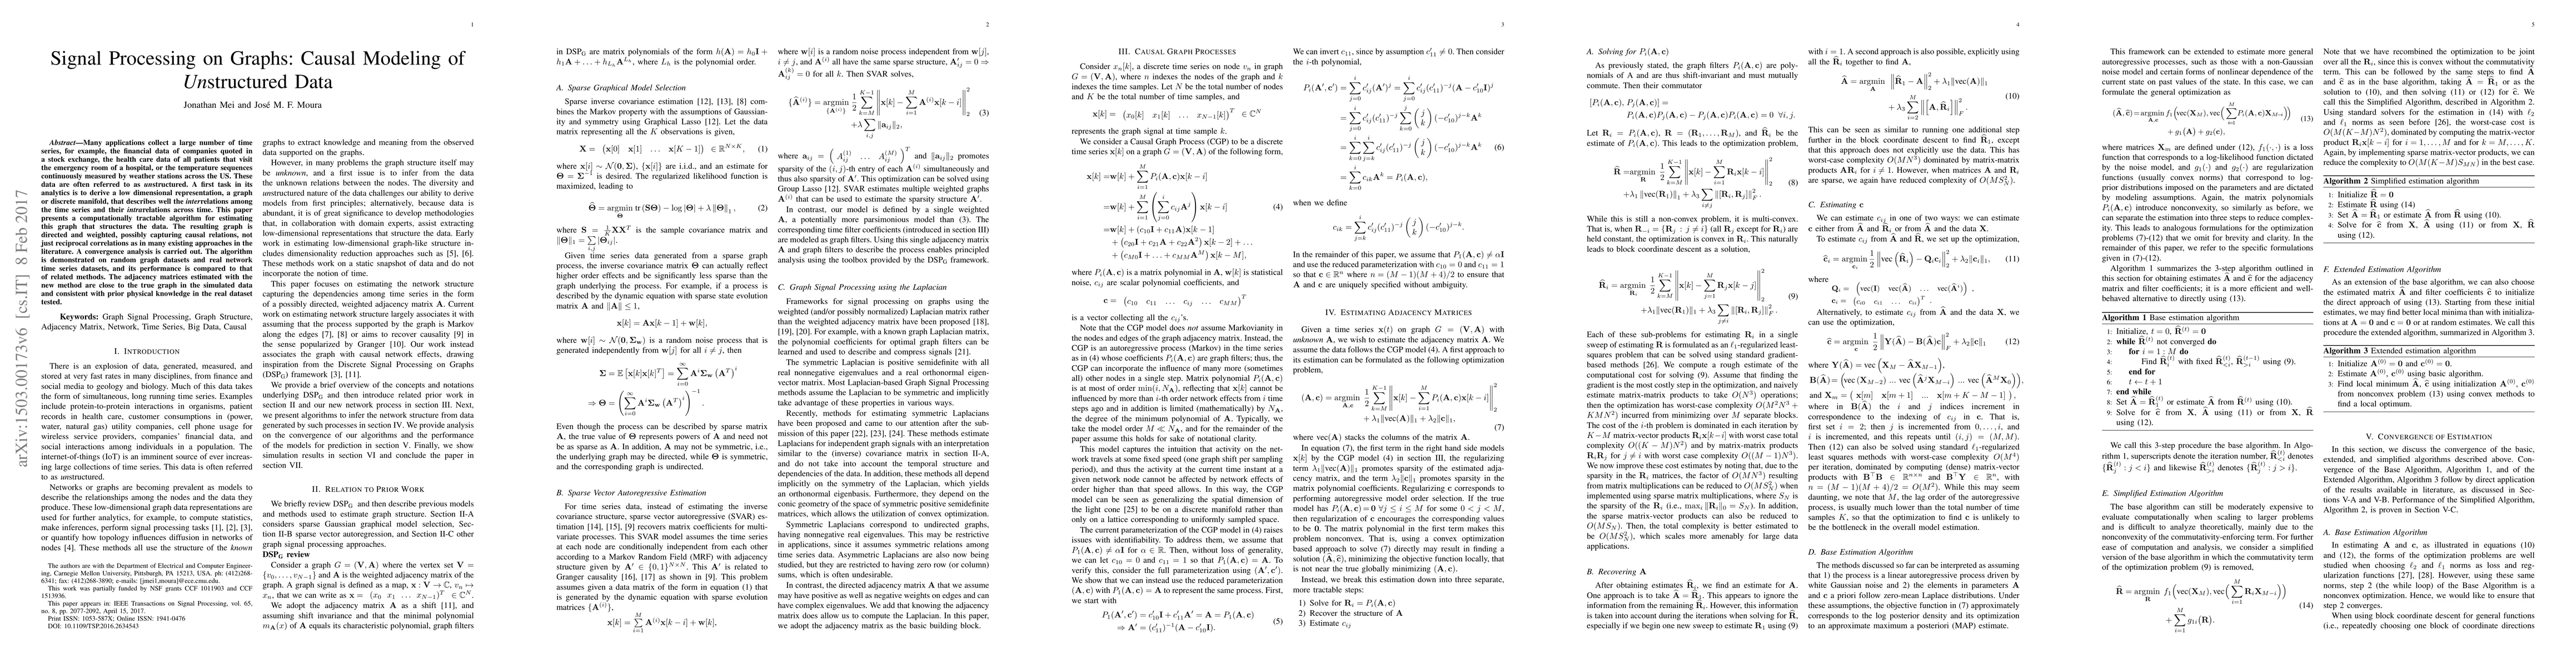
Many applications collect a large number of time series, for example, the financial data of companies quoted in a stock exchange, the health care data of all patients that visit the emergency room of a hospital, or the temperature sequences continuously measured by weather stations across the US. These data are often referred to as unstructured. A first task in its analytics is to derive a low dimensional representation, a graph or discrete manifold, that describes well the interrelations among the time series and their intrarelations across time. This paper presents a computationally tractable algorithm for estimating this graph that structures the data. The resulting graph is directed and weighted, possibly capturing causal relations, not just reciprocal correlations as in many existing approaches in the literature. A convergence analysis is carried out. The algorithm is demonstrated on random graph datasets and real network time series datasets, and its performance is compared to that of related methods. The adjacency matrices estimated with the new method are close to the true graph in the simulated data and consistent with prior physical knowledge in the real dataset tested.
AI Key Findings
Get AI-generated insights about this paper's methodology, results, significance, and more — seven facets brought into focus.
Impact
Paper Details
PDF Preview
Key Terms
Citation Network
Current paper (gray), citations (green), references (blue)
Display is limited for performance on very large graphs.
Discussion 0