Similarities among top one day batters: physics-based quantification
Publication
Metrics
AI Quick Summary
This study applies physics-based statistical methods to analyze the performance of top one-day cricket batters, finding linear relationships between various performance metrics and average runs. The analysis reveals two performance clusters, indicating differences between old and recent players, and identifies similarities among batters through probability vector comparisons.
Paper Preview
Abstract
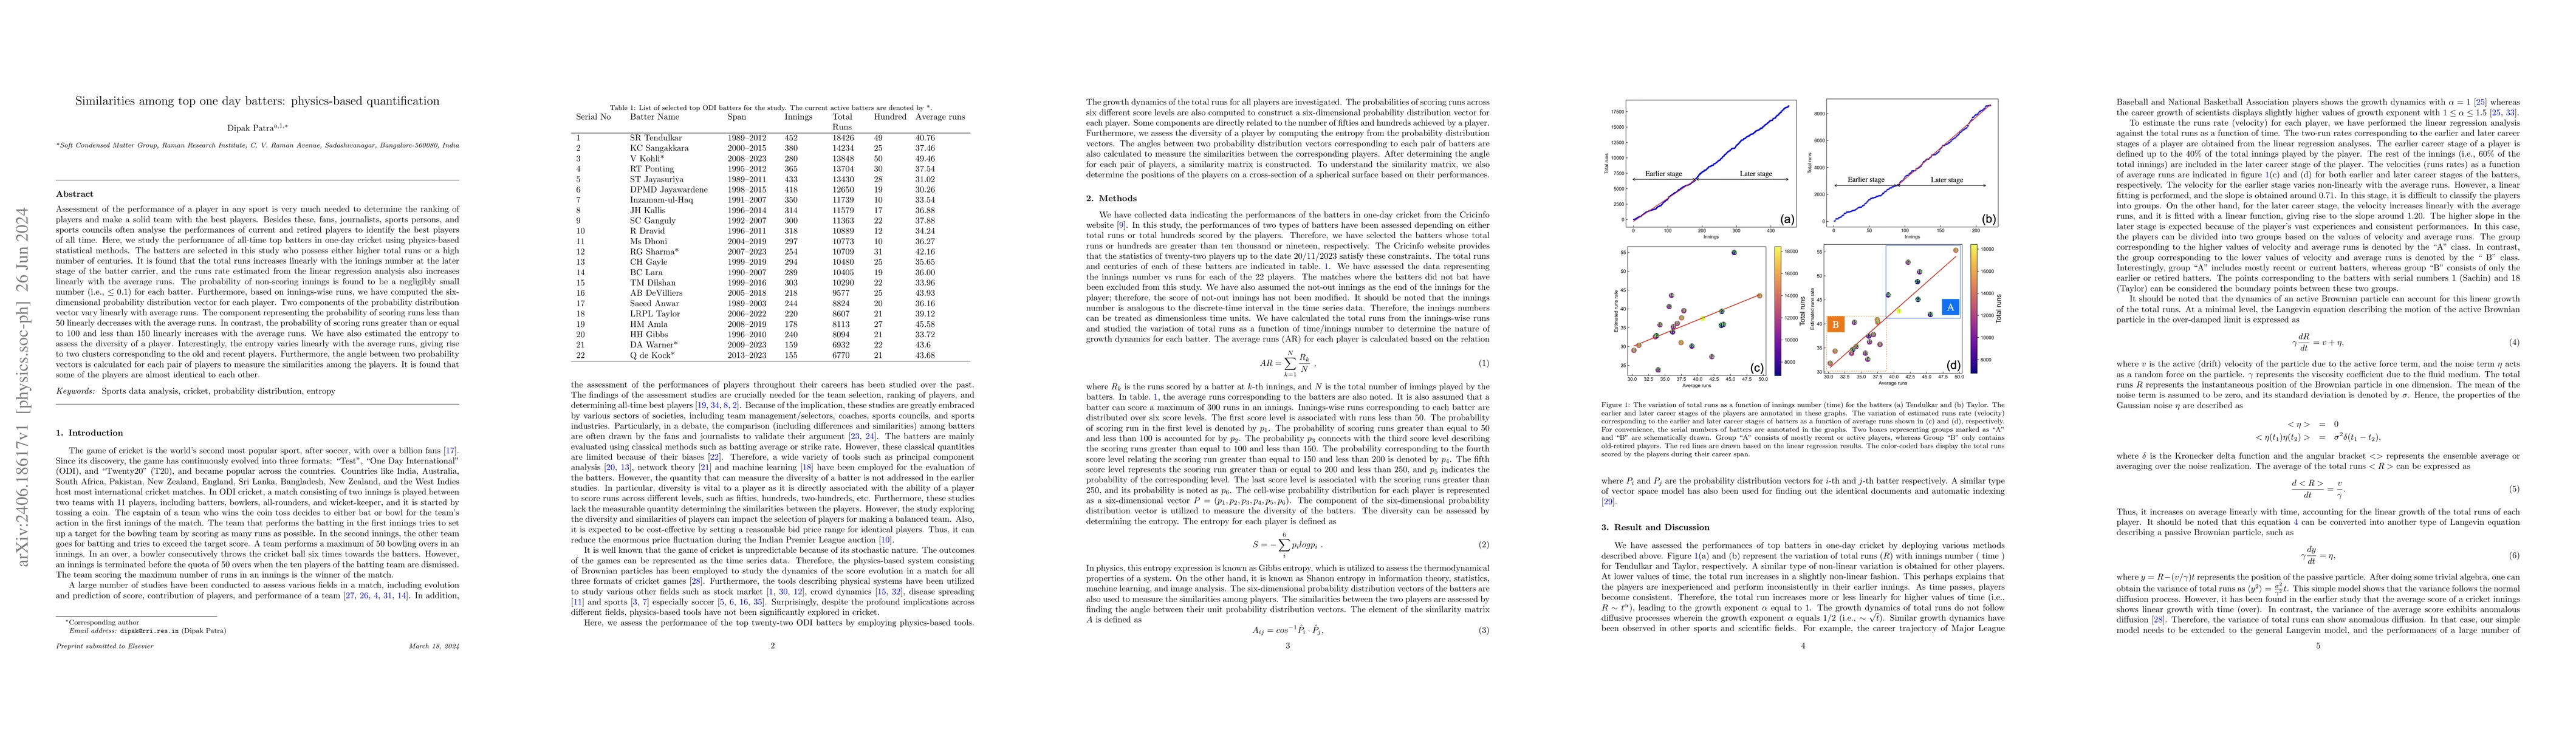
Assessment of the performance of a player in any sport is very much needed to determine the ranking of players and make a solid team with the best players. Besides these, fans, journalists, sports persons, and sports councils often analyse the performances of current and retired players to identify the best players of all time. Here, we study the performance of all-time top batters in one-day cricket using physics-based statistical methods. The batters are selected in this study who possess either higher total runs or a high number of centuries. It is found that the total runs increases linearly with the innings number at the later stage of the batter carrier, and the runs rate estimated from the linear regression analysis also increases linearly with the average runs. The probability of non-scoring innings is found to be a negligibly small number (i.e., $\leq 0.1$ ) for each batter. Furthermore, based on innings-wise runs, we have computed the six-dimensional probability distribution vector for each player. Two components of the probability distribution vector vary linearly with average runs. The component representing the probability of scoring runs less than 50 linearly decreases with the average runs. In contrast, the probability of scoring runs greater than or equal to 100 and less than 150 linearly increases with the average runs. We have also estimated the entropy to assess the diversity of a player. Interestingly, the entropy varies linearly with the average runs, giving rise to two clusters corresponding to the old and recent players. Furthermore, the angle between two probability vectors is calculated for each pair of players to measure the similarities among the players. It is found that some of the players are almost identical to each other.
AI Key Findings
Get AI-generated insights about this paper's methodology, results, significance, and more — seven facets brought into focus.
Impact
Paper Details
Authors
PDF Preview
Key Terms
Citation Network
Current paper (gray), citations (green), references (blue)
Display is limited for performance on very large graphs.
Discussion 0