Simulation-based Estimation of Mean and Standard Deviation for Meta-analysis via Approximate Bayesian Computation (ABC)
Publication
Metrics
AI Quick Summary
This paper proposes an Approximate Bayesian Computation (ABC) method for estimating mean and standard deviation in meta-analysis when direct values are unavailable. The ABC method performs best for skewed or heavy-tailed distributions, showing lower average relative error compared to existing methods, especially as sample sizes increase.
Paper Preview
Abstract
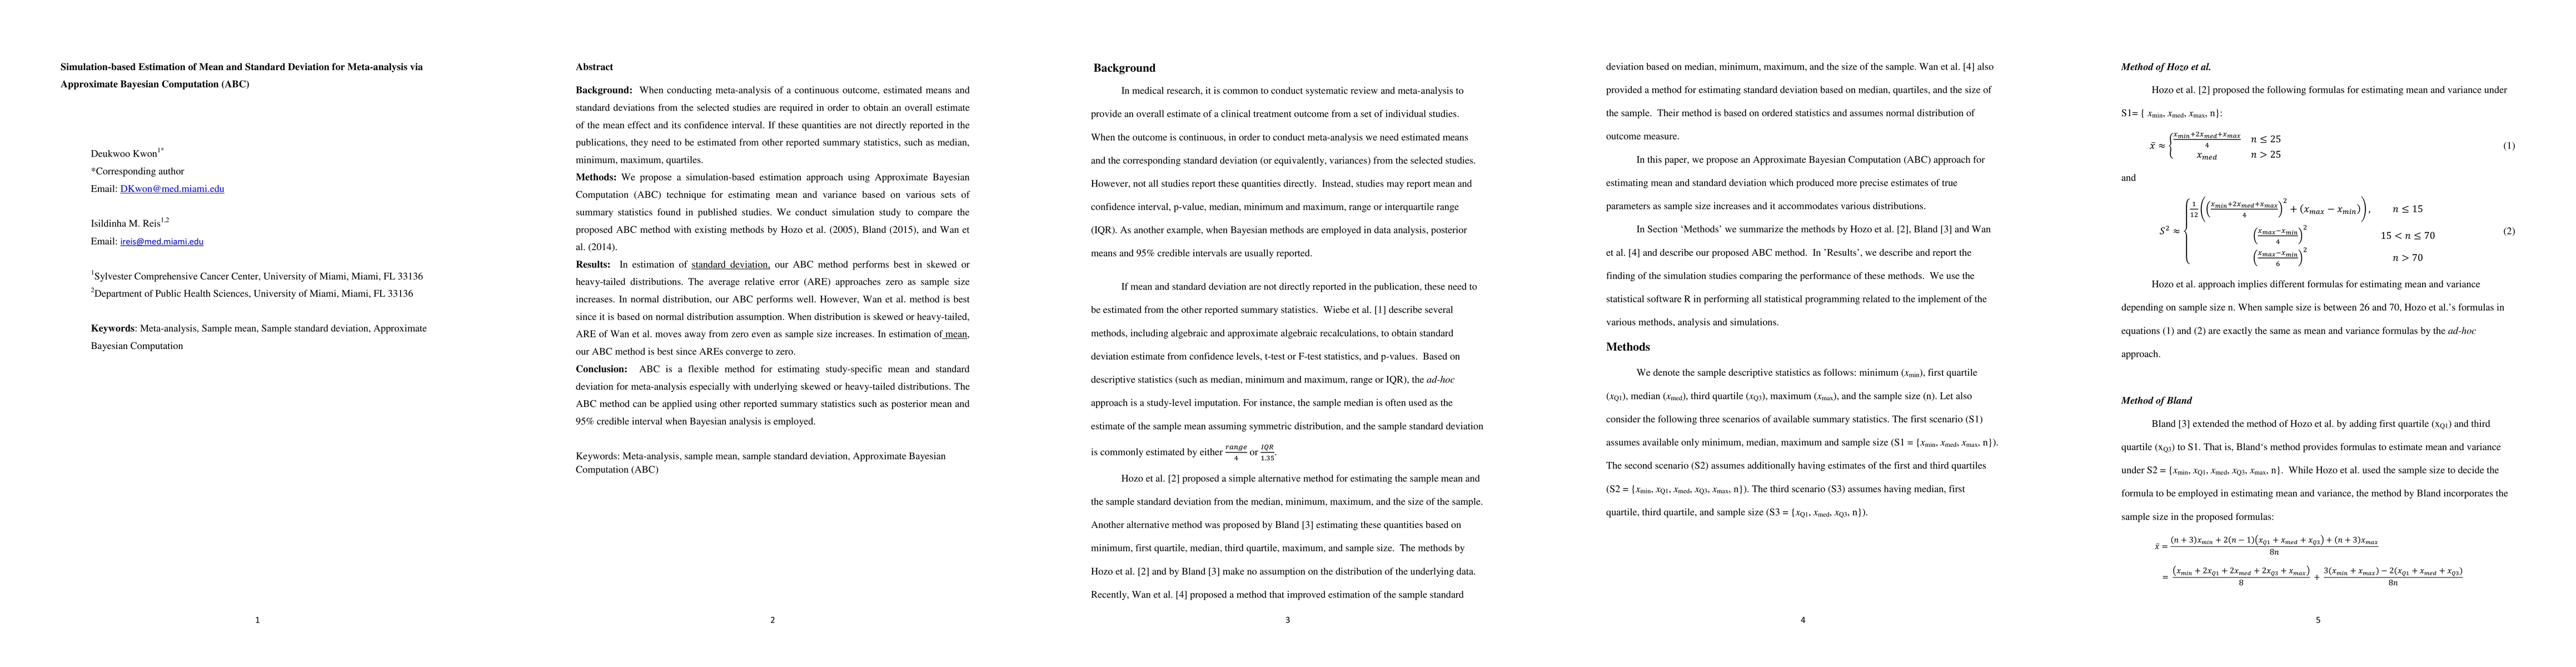
Background: When conducting a meta-analysis of a continuous outcome, estimated means and standard deviations from the selected studies are required in order to obtain an overall estimate of the mean effect and its confidence interval. If these quantities are not directly reported in the publications, they need to must be estimated from other reported summary statistics, such as the median, the minimum, the maximum, and quartiles. Methods: We propose a simulation-based estimation approach using the Approximate Bayesian Computation (ABC) technique for estimating mean and standard deviation based on various sets of summary statistics found in published studies. We conduct a simulation study to compare the proposed ABC method with the existing methods of Hozo et al. (2005), Bland (2015), and Wan et al. (2014). Results: In the estimation of the standard deviation, our ABC method performs best in skewed or heavy-tailed distributions. The average relative error (ARE) approaches zero as sample size increases. In the normal distribution, our ABC performs well. However, the Wan et al. method is best since it is based on the normal distribution assumption. When the distribution is skewed or heavy-tailed, the ARE of Wan et al. moves away from zero even as sample size increases. In the estimation of the mean, our ABC method is best since the AREs converge to zero. Conclusion: ABC is a flexible method for estimating the study-specific mean and standard deviation for meta-analysis, especially with underlying skewed or heavy-tailed distributions. The ABC method can be applied using other reported summary statistics such as the posterior mean and 95% credible interval when Bayesian analysis has been employed.
AI Key Findings
Get AI-generated insights about this paper's methodology, results, significance, and more — seven facets brought into focus.
Discussion 0