Simulation-based Inference of Developmental EEG Maturation with the Spectral Graph Model
Publication
Metrics
AI Quick Summary
This study uses a spectral graph model to investigate how developmental EEG spectral changes relate to brain network formation and dynamics. Simulation-based inference reveals that maturation is supported by functional adaptations in long-range coupling, axonal conductance speed, and excitatory:inhibitory balance.
Paper Preview
Abstract
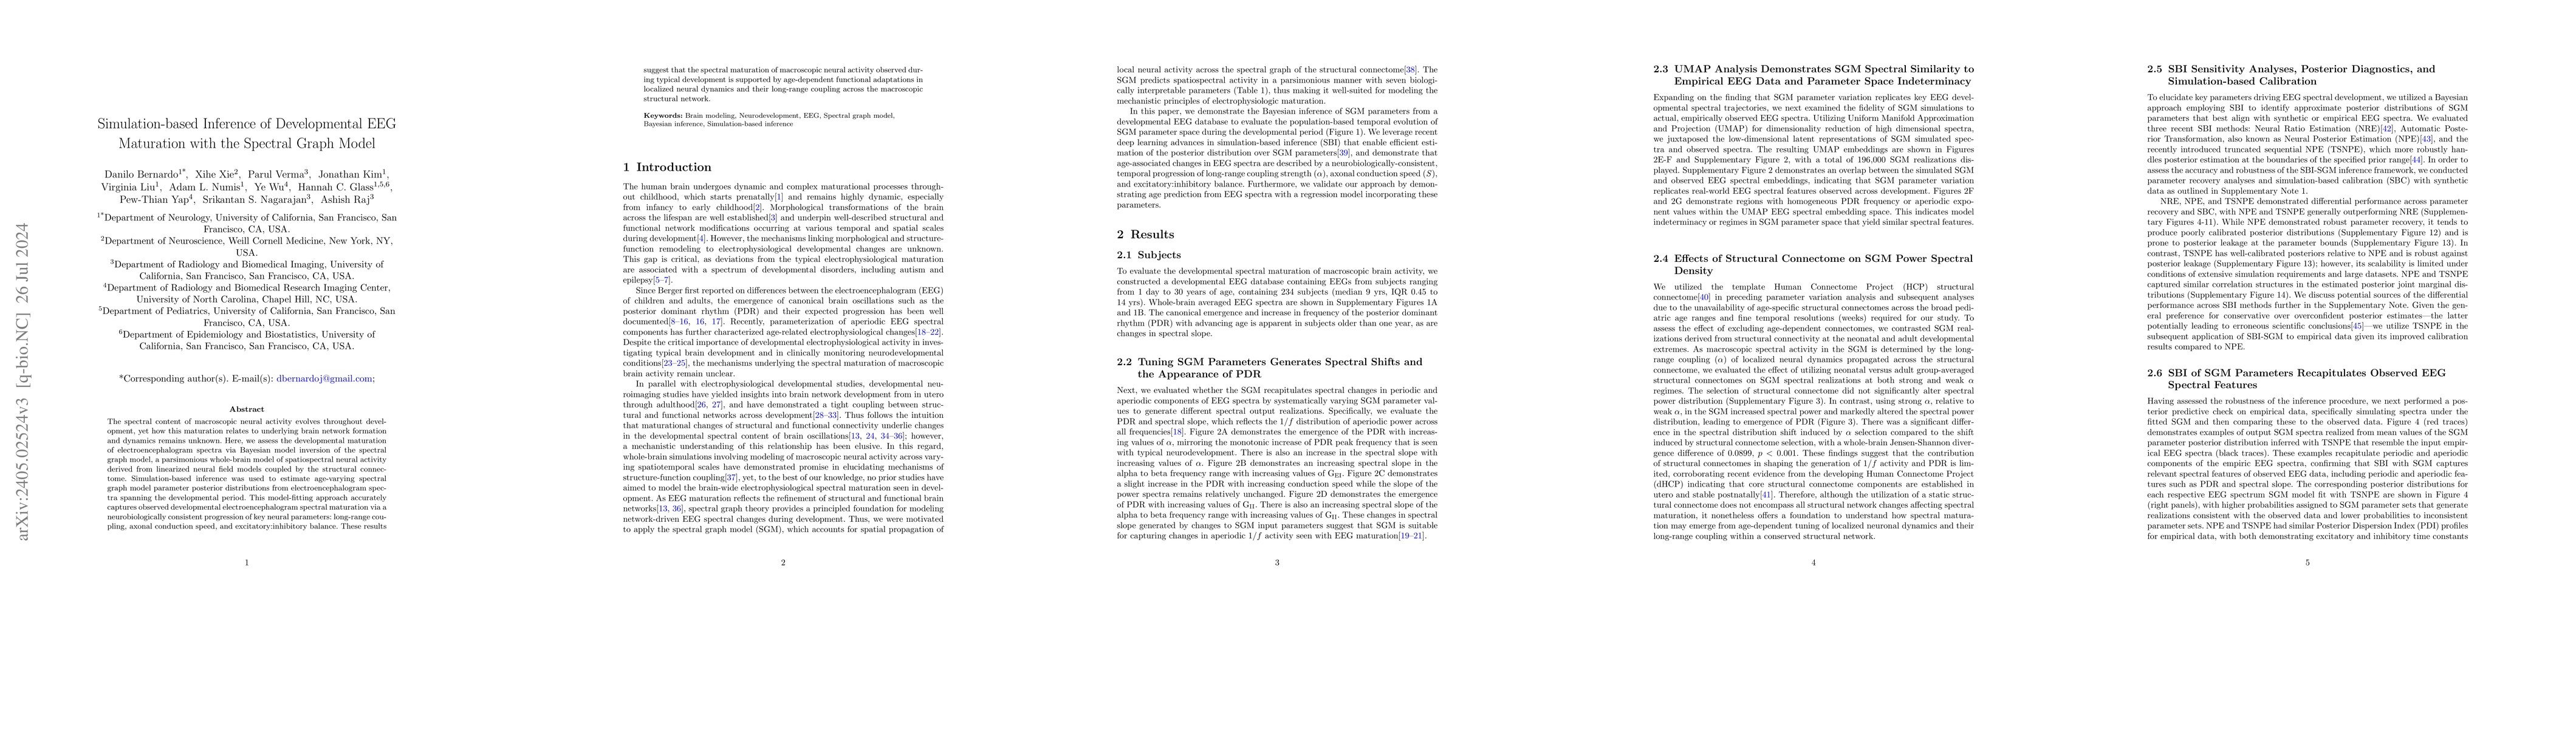
The spectral content of macroscopic neural activity evolves throughout development, yet how this maturation relates to underlying brain network formation and dynamics remains unknown. To gain mechanistic insights into this process, we evaluate developmental EEG spectral changes via Bayesian model inversion of the spectral graph model (SGM), a parsimonious model of whole-brain spatiospectral activity derived from linearized neural field models coupled by the structural connectome. Simulation-based inference was used to estimate age-varying SGM parameter posterior distributions from EEG spectra spanning the developmental period. We found this model-fitting approach accurately captures the developmental maturation of EEG spectra via a neurobiologically consistent progression of key neural parameters: long-range coupling, axonal conductance speed, and excitatory:inhibitory balance. These results suggest that spectral maturation of brain activity observed during normal development is supported by functional adaptations, specifically age-dependent tuning of localized neural dynamics and their long-range coupling within the macroscopic, structural network.
AI Key Findings
Get AI-generated insights about this paper's methodology, results, significance, and more — seven facets brought into focus.
Impact
Paper Details
Authors
PDF Preview
Key Terms
Citation Network
Current paper (gray), citations (green), references (blue)
Display is limited for performance on very large graphs.
Discussion 0