Simulation tools to compare and optimize the mobility plans
Publication
Metrics
AI Quick Summary
This research utilizes MATSim simulation tools to compare two mobility models for Barcelona, varying car speed limits and bike network presence. Results indicate that lower car speeds and increased bike infrastructure reduce average travel time and boost cycling usage, while decreasing public transport users more than private ones, highlighting the importance of bus network integration for effective metro network performance.
Paper Preview
Abstract
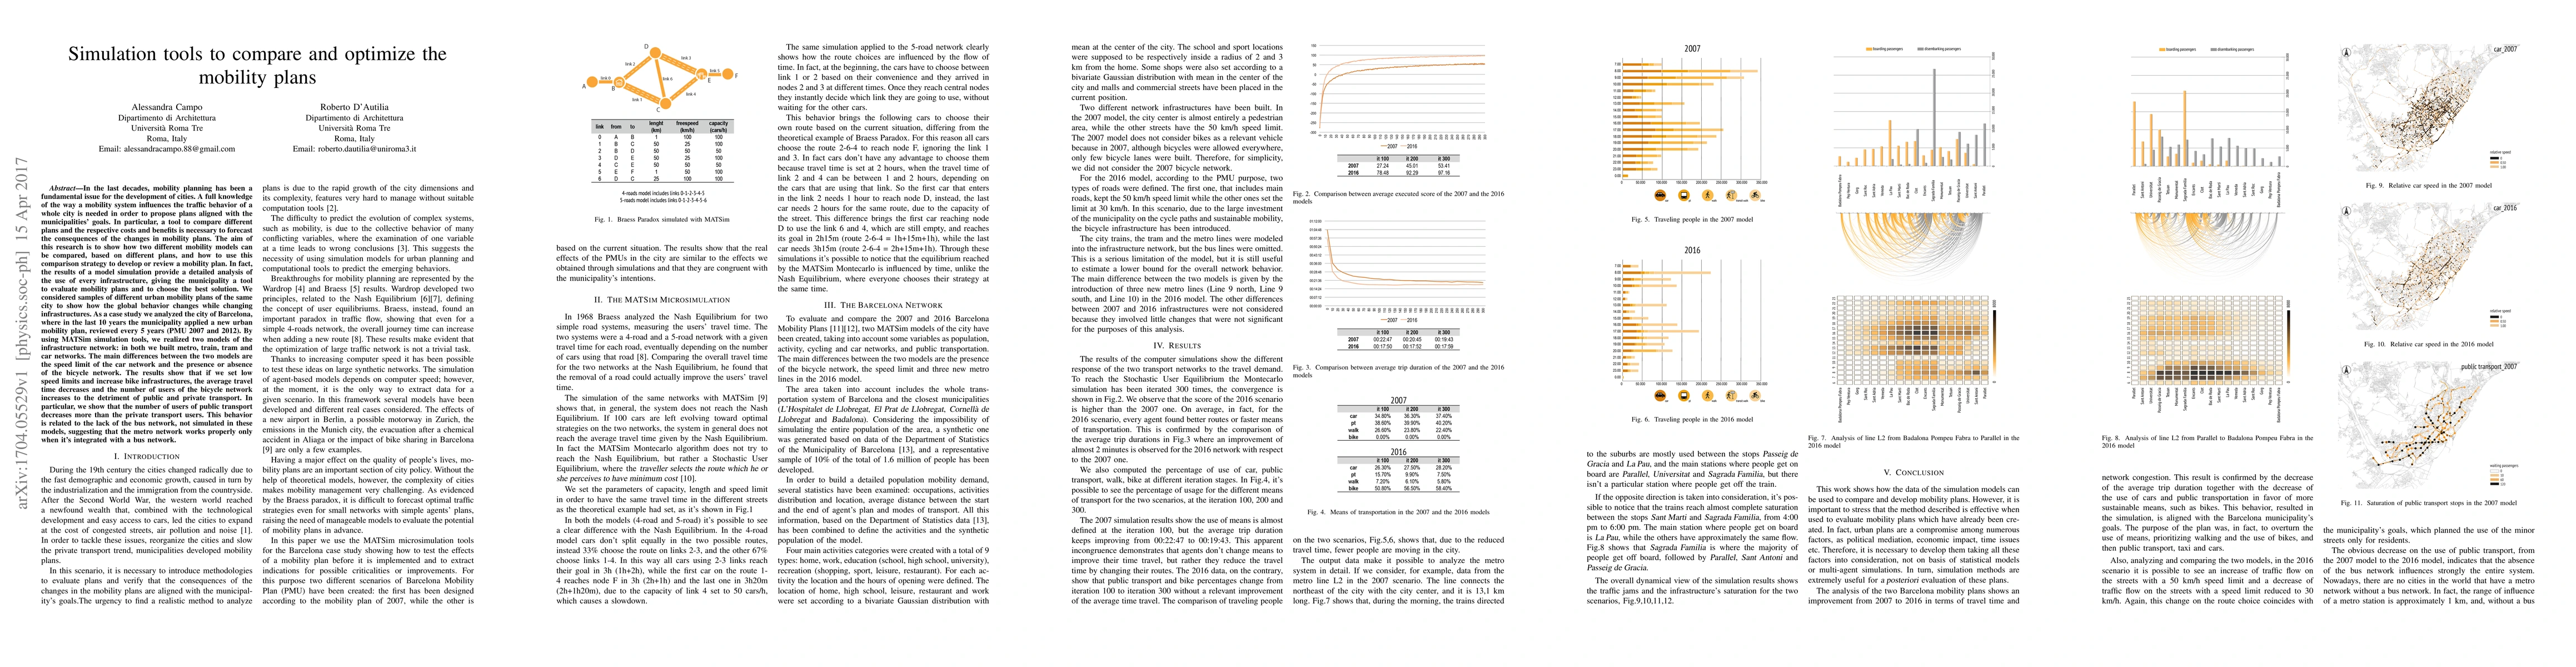
In the last decades, mobility planning has been a fundamental issue for the development of cities. A full knowledge of the way a mobility system influences the traffic behavior of a whole city is needed in order to propose plans aligned with the municipalities' goals. In particular, a tool to compare different plans and the respective costs and benefits is necessary to forecast the consequences of the changes in mobility plans. The aim of this research is to show how two different mobility models can be compared, based on different plans, and how to use this comparison strategy to develop or review a mobility plan. As a case study we analyzed the city of Barcelona, where in the last 10 years the municipality applied a new urban mobility plan, reviewed every 5 years (PMU 2007 and 2012). By using MATSim simulation tools, we realized two models of the infrastructure network: in both we built metro, train, tram and car networks. The main differences between the two models are the speed limit of the car network and the presence or absence of the bicycle network. The results show that if we set low speed limits and increase bike infrastructures, the average travel time decreases and the number of users of the bicycle network increases to the detriment of public and private transport. In particular, we show that the number of users of public transport decreases more than the private transport users. This behavior is related to the lack of the bus network, not simulated in these models, suggesting that the metro network works properly only when it is integrated with a bus network.
AI Key Findings
Get AI-generated insights about this paper's methodology, results, significance, and more — seven facets brought into focus.
Impact
Paper Details
PDF Preview
Key Terms
Citation Network
Current paper (gray), citations (green), references (blue)
Display is limited for performance on very large graphs.
Discussion 0