Summary
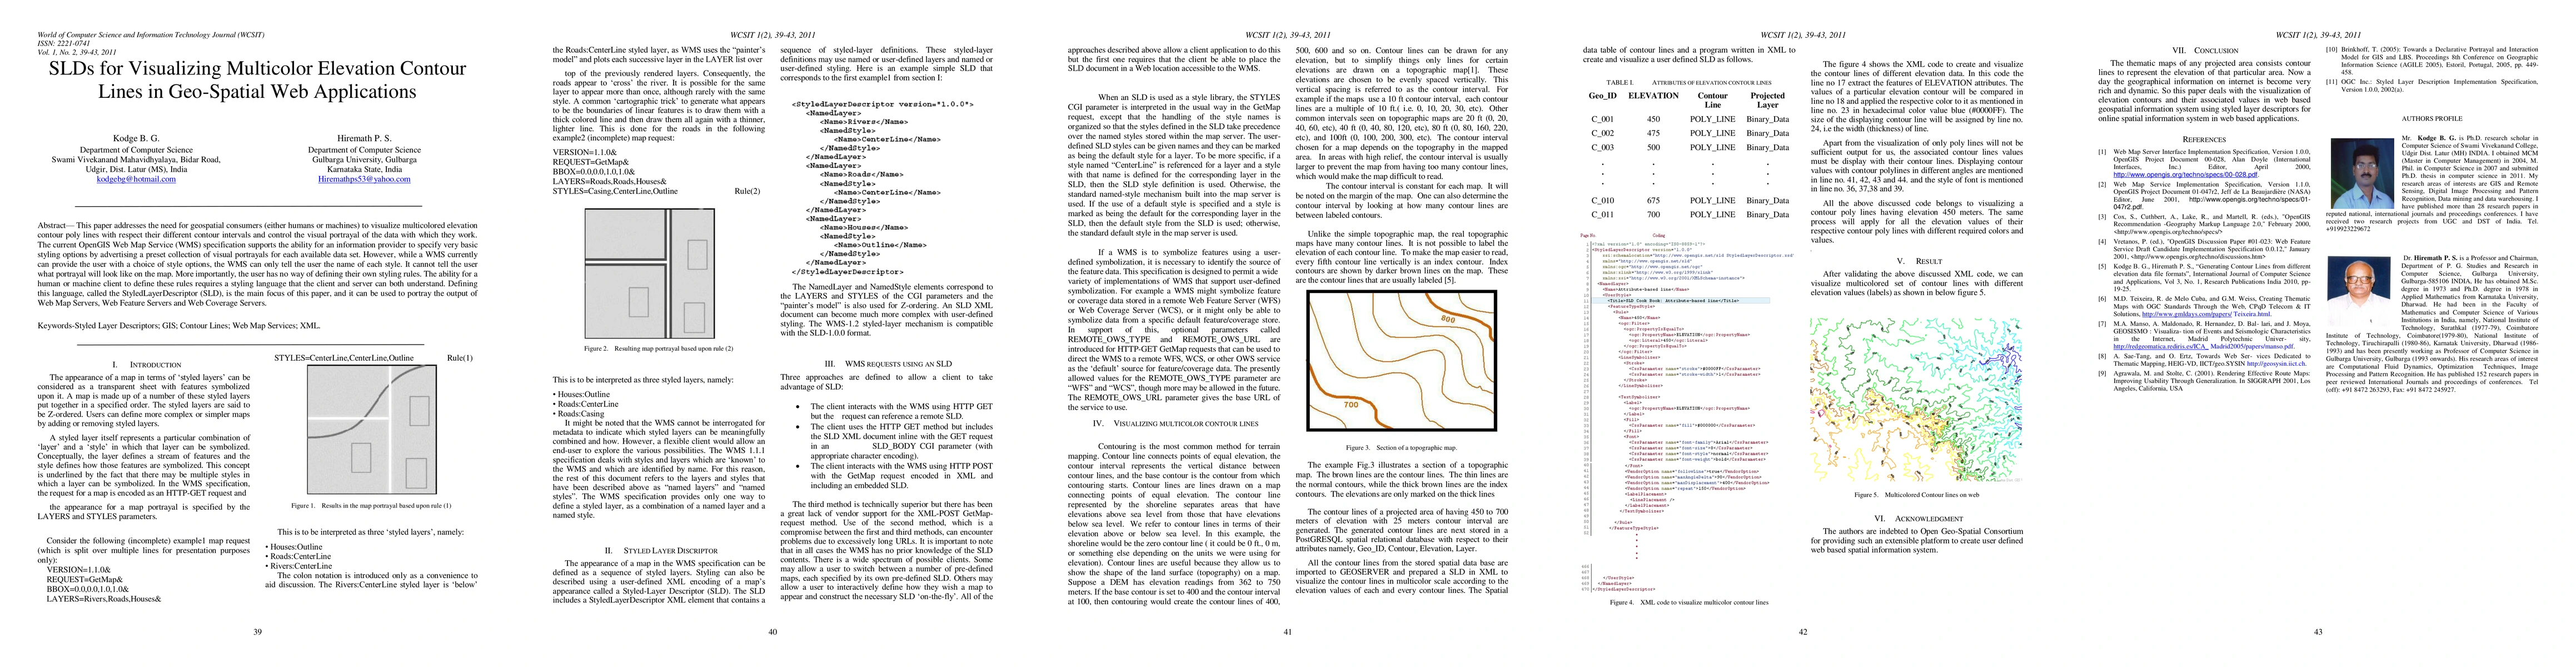
This paper addresses the need for geospatial consumers (either humans or machines) to visualize multicolored elevation contour poly lines with respect their different contour intervals and control the visual portrayal of the data with which they work. The current OpenGIS Web Map Service (WMS) specification supports the ability for an information provider to specify very basic styling options by advertising a preset collection of visual portrayals for each available data set. However, while a WMS currently can provide the user with a choice of style options, the WMS can only tell the user the name of each style. It cannot tell the user what portrayal will look like on the map. More importantly, the user has no way of defining their own styling rules. The ability for a human or machine client to define these rules requires a styling language that the client and server can both understand. Defining this language, called the StyledLayerDescriptor (SLD), is the main focus of this paper, and it can be used to portray the output of Web Map Servers, Web Feature Servers and Web Coverage Servers.
AI Key Findings
Get AI-generated insights about this paper's methodology, results, and significance.
Paper Details
PDF Preview
Key Terms
Citation Network
Current paper (gray), citations (green), references (blue)
Display is limited for performance on very large graphs.
Similar Papers
Found 4 papersReconstruction of Contour Lines During the Digitization of Contour Maps to Build a Digital Elevation Model
Aroj Subedi, Pradip Ganesh, Sandip Mishra
No citations found for this paper.
Comments (0)