Sleep and Activity Patterns as Transdiagnostic Behavioral Biomarkers in Psychiatry: Initial Insights from the DeeP-DD study
Publication
Metrics
Paper Preview
Abstract
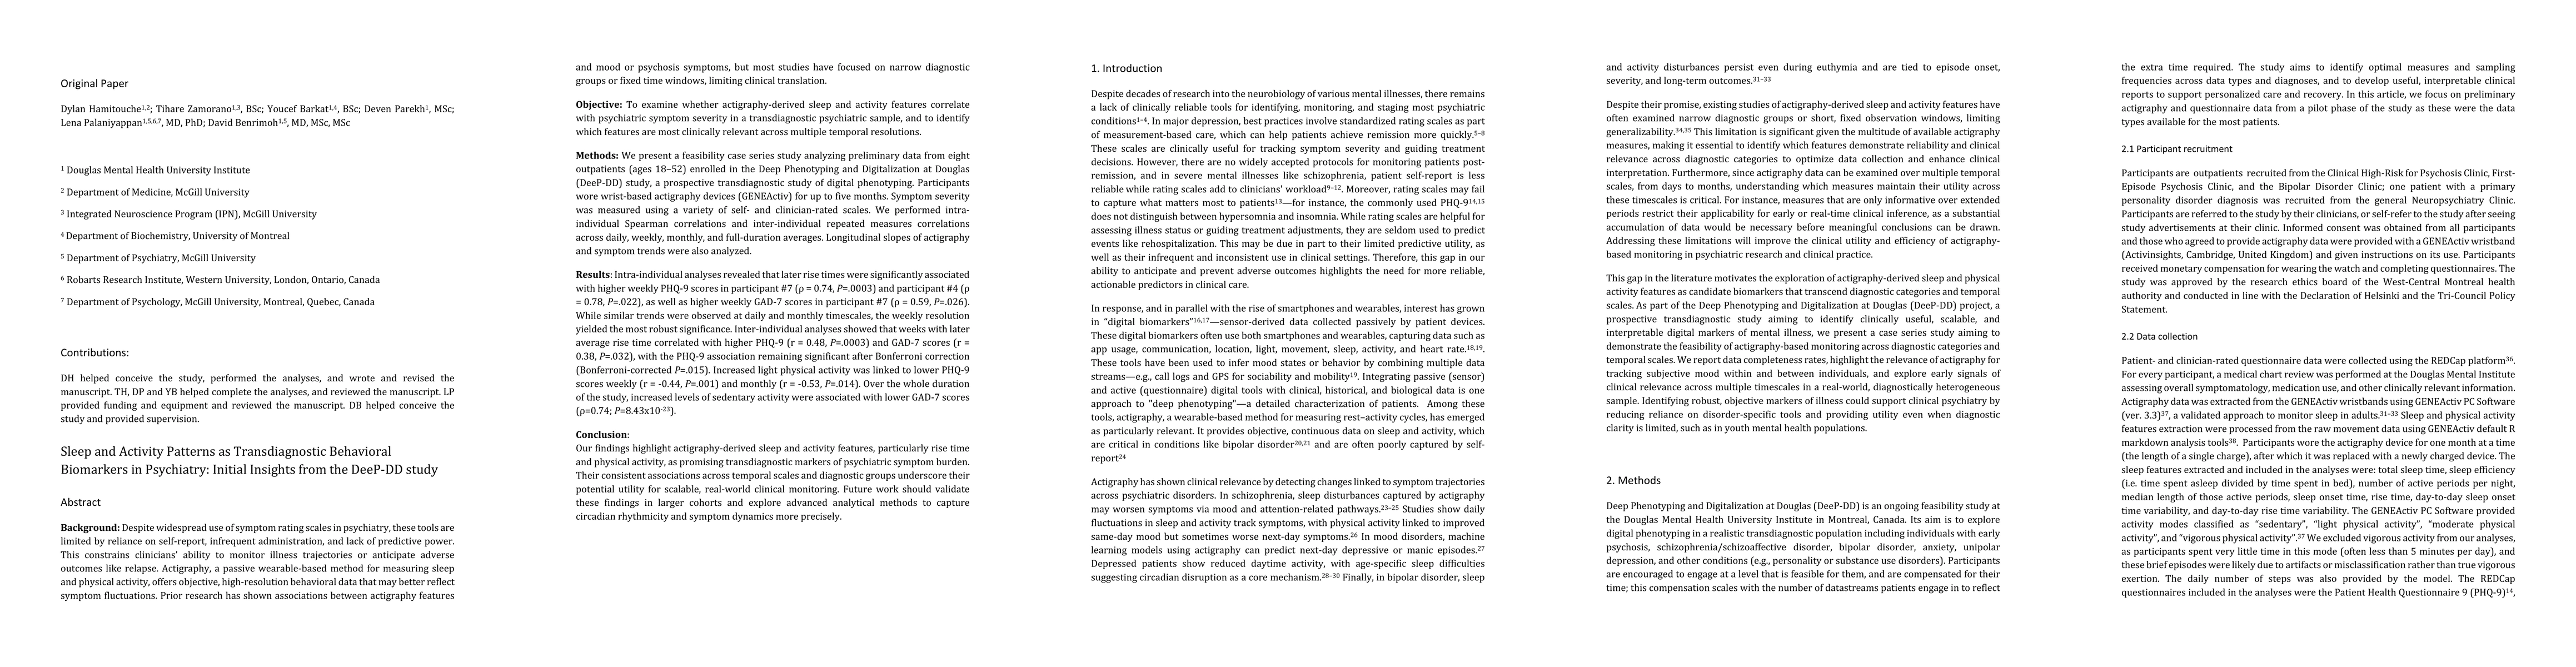
Background: Symptom rating scales in psychiatry are limited by reliance on self-report, and lack of predictive power. Actigraphy, a passive wearable-based method for measuring sleep and physical activity, offers objective, high-resolution behavioral data that may better reflect symptom fluctuations, but most studies have focused on narrow diagnostic groups or fixed time windows, limiting clinical translation. Objective: To examine whether actigraphy-derived sleep and activity features correlate with psychiatric symptom severity in a transdiagnostic psychiatric sample, and to identify which features are most clinically relevant across multiple temporal resolutions. Methods: We present a feasibility case series study with preliminary data from eight outpatients enrolled in the DeeP-DD study, a transdiagnostic study of digital phenotyping. Participants wore GENEActiv actigraphy devices and symptom severity was measured using a variety of validated scales. We performed intra-individual Spearman correlations and inter-individual repeated measures correlations across daily, weekly, monthly, and full-duration averages. Results: Intra-individual analyses revealed that later rise times were significantly associated with higher weekly PHQ-9 scores in participant #7 (\r{ho} = 0.74, P=.0003) and participant #4 (\r{ho} = 0.78, P=.022), as well as higher weekly GAD-7 scores in participant #7 (\r{ho} = 0.59, P=.026). Inter-individual analyses showed that weeks with later average rise time correlated with higher PHQ-9 (r = 0.48, P=.0003) and GAD-7 scores (r = 0.38, P=.032). Increased light physical activity was linked to lower PHQ-9 scores weekly (r = -0.44, P=.001) and monthly (r = -0.53, P=.014). Conclusion: Consistent associations between actigraphy features and symptoms across temporal scales and diagnostic groups underscore their potential utility for scalable, real-world clinical monitoring.
AI Key Findings
Get AI-generated insights about this paper's methodology, results, significance, and more — seven facets brought into focus.
Impact
Authors
PDF Preview
Citation Network
Current paper (gray), citations (green), references (blue)
Display is limited for performance on very large graphs.
Discussion 0