Publication
Metrics
AI Quick Summary
ReLayTracer is a per-request, per-layer IO profiler that provides detailed analysis of kernel IO stack latency distributions, hardware performance behavior, and time spent by kernel activities.
Paper Preview
Abstract
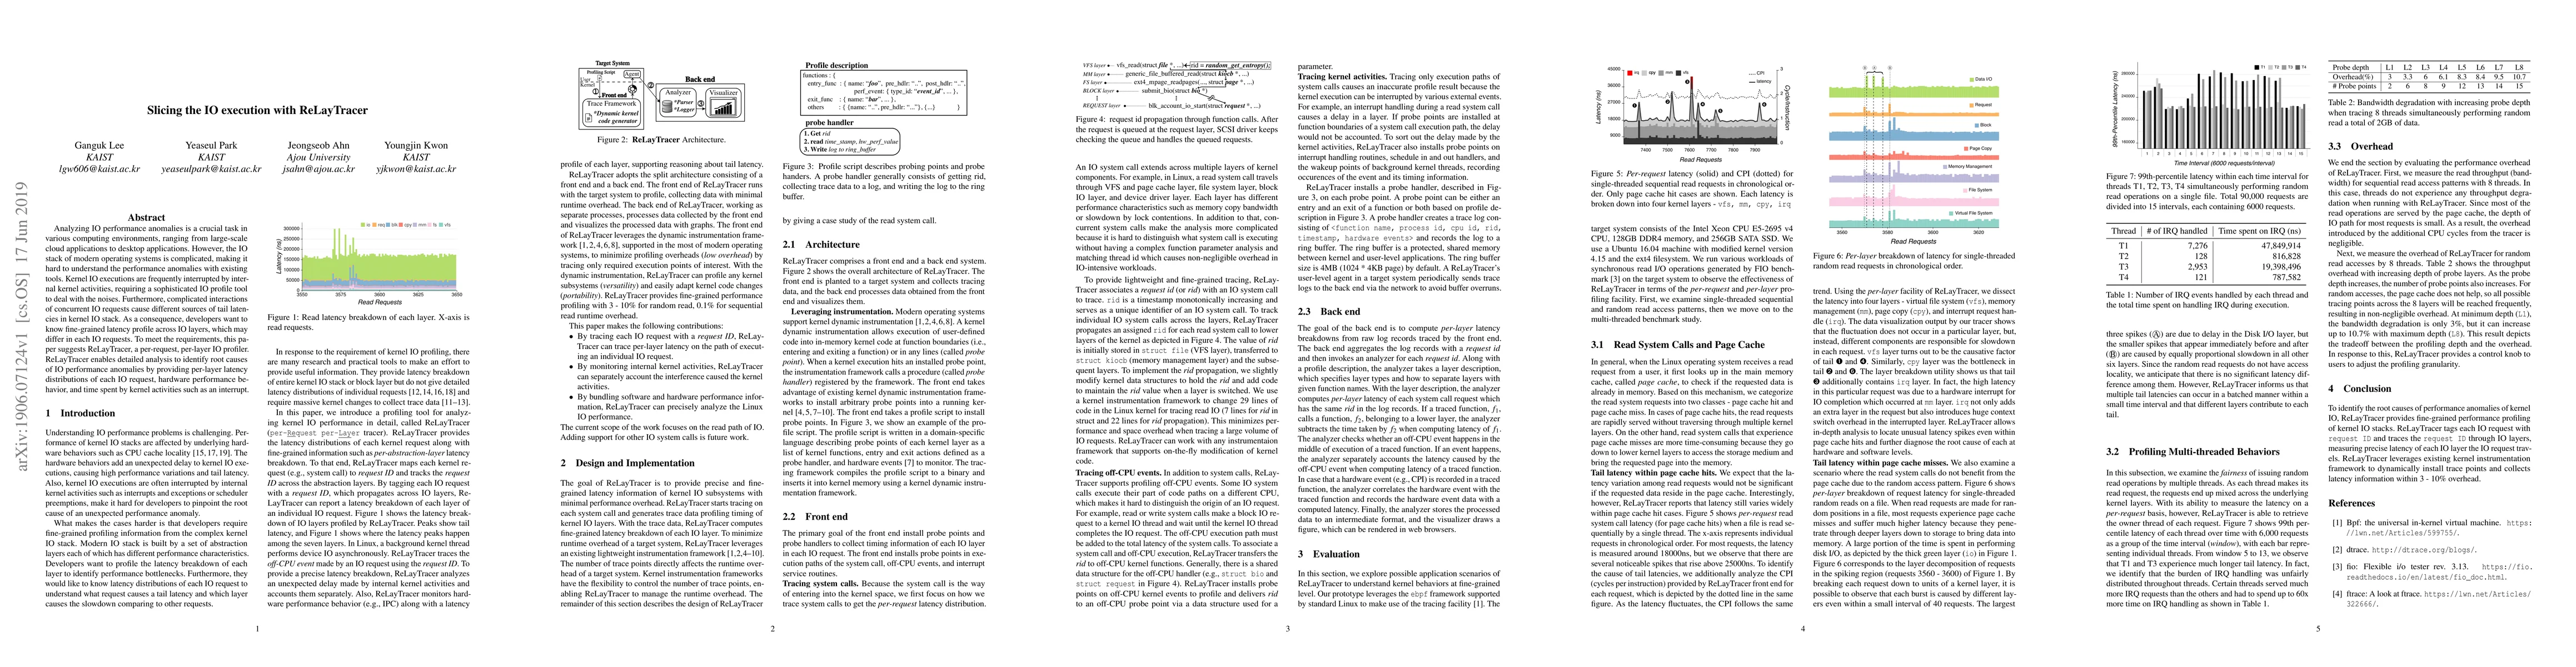
Analyzing IO performance anomalies is a crucial task in various computing environments, ranging from large-scale cloud applications to desktop applications. However, the IO stack of modern operating systems is complicated, making it hard to understand the performance anomalies with existing tools. Kernel IO executions are frequently interrupted by internal kernel activities, requiring a sophisticated IO profile tool to deal with the noises. Furthermore, complicated interactions of concurrent IO requests cause different sources of tail latencies in kernel IO stack. As a consequence, developers want to know fine-grained latency profile across IO layers, which may differ in each IO requests. To meet the requirements, this paper suggests ReLayTracer, a per-request, per-layer IO profiler. ReLayTracer enables a detailed analysis to identify root causes of IO performance anomalies by providing per-layer latency distributions of each IO request, hardware performance behavior, and time spent by kernel activities such as an interrupt.
AI Key Findings
Get AI-generated insights about this paper's methodology, results, significance, and more — seven facets brought into focus.
Impact
Paper Details
PDF Preview
Key Terms
Citation Network
Current paper (gray), citations (green), references (blue)
Display is limited for performance on very large graphs.
Discussion 0