SLRL: Structured Latent Representation Learning for Multi-view Clustering
Publication
Metrics
AI Quick Summary
SLRL integrates complementary and structural information for multi-view clustering, constructing a k-nearest neighbor graph from a common latent representation to enhance sample interaction, achieving competitive performance against existing methods.
Paper Preview
Abstract
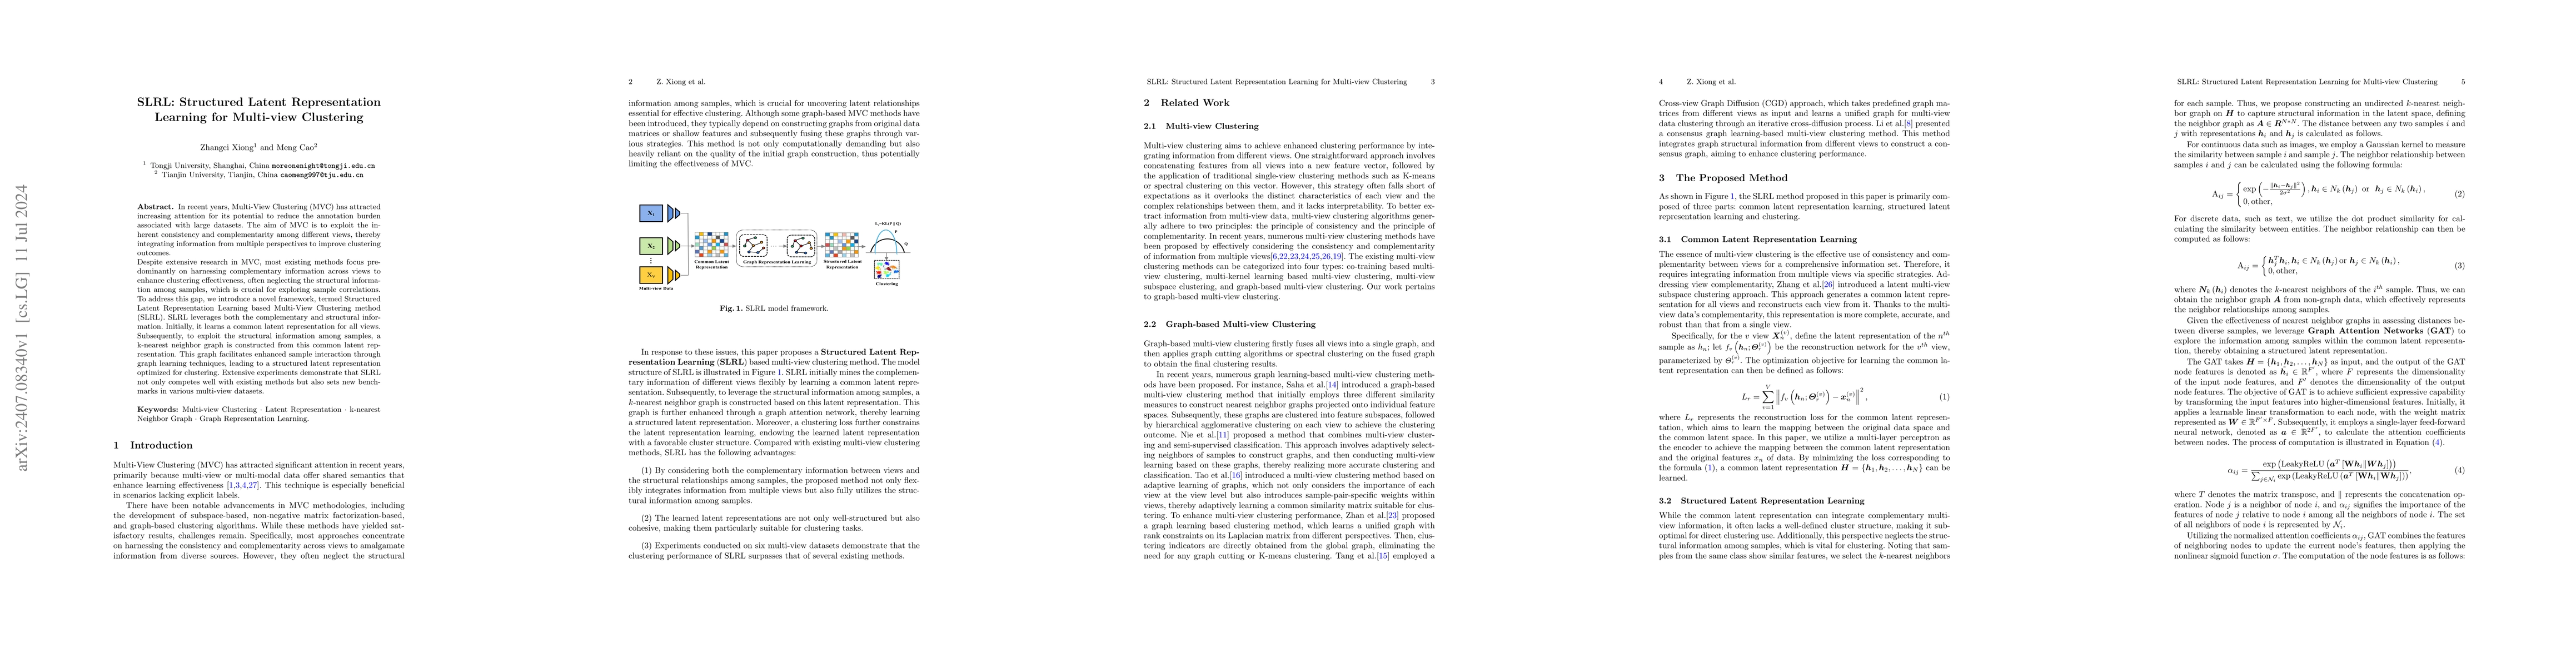
In recent years, Multi-View Clustering (MVC) has attracted increasing attention for its potential to reduce the annotation burden associated with large datasets. The aim of MVC is to exploit the inherent consistency and complementarity among different views, thereby integrating information from multiple perspectives to improve clustering outcomes. Despite extensive research in MVC, most existing methods focus predominantly on harnessing complementary information across views to enhance clustering effectiveness, often neglecting the structural information among samples, which is crucial for exploring sample correlations. To address this gap, we introduce a novel framework, termed Structured Latent Representation Learning based Multi-View Clustering method (SLRL). SLRL leverages both the complementary and structural information. Initially, it learns a common latent representation for all views. Subsequently, to exploit the structural information among samples, a k-nearest neighbor graph is constructed from this common latent representation. This graph facilitates enhanced sample interaction through graph learning techniques, leading to a structured latent representation optimized for clustering. Extensive experiments demonstrate that SLRL not only competes well with existing methods but also sets new benchmarks in various multi-view datasets.
AI Key Findings
Get AI-generated insights about this paper's methodology, results, significance, and more — seven facets brought into focus.
Impact
Authors
PDF Preview
Key Terms
Citation Network
Current paper (gray), citations (green), references (blue)
Display is limited for performance on very large graphs.
Discussion 0