Summary
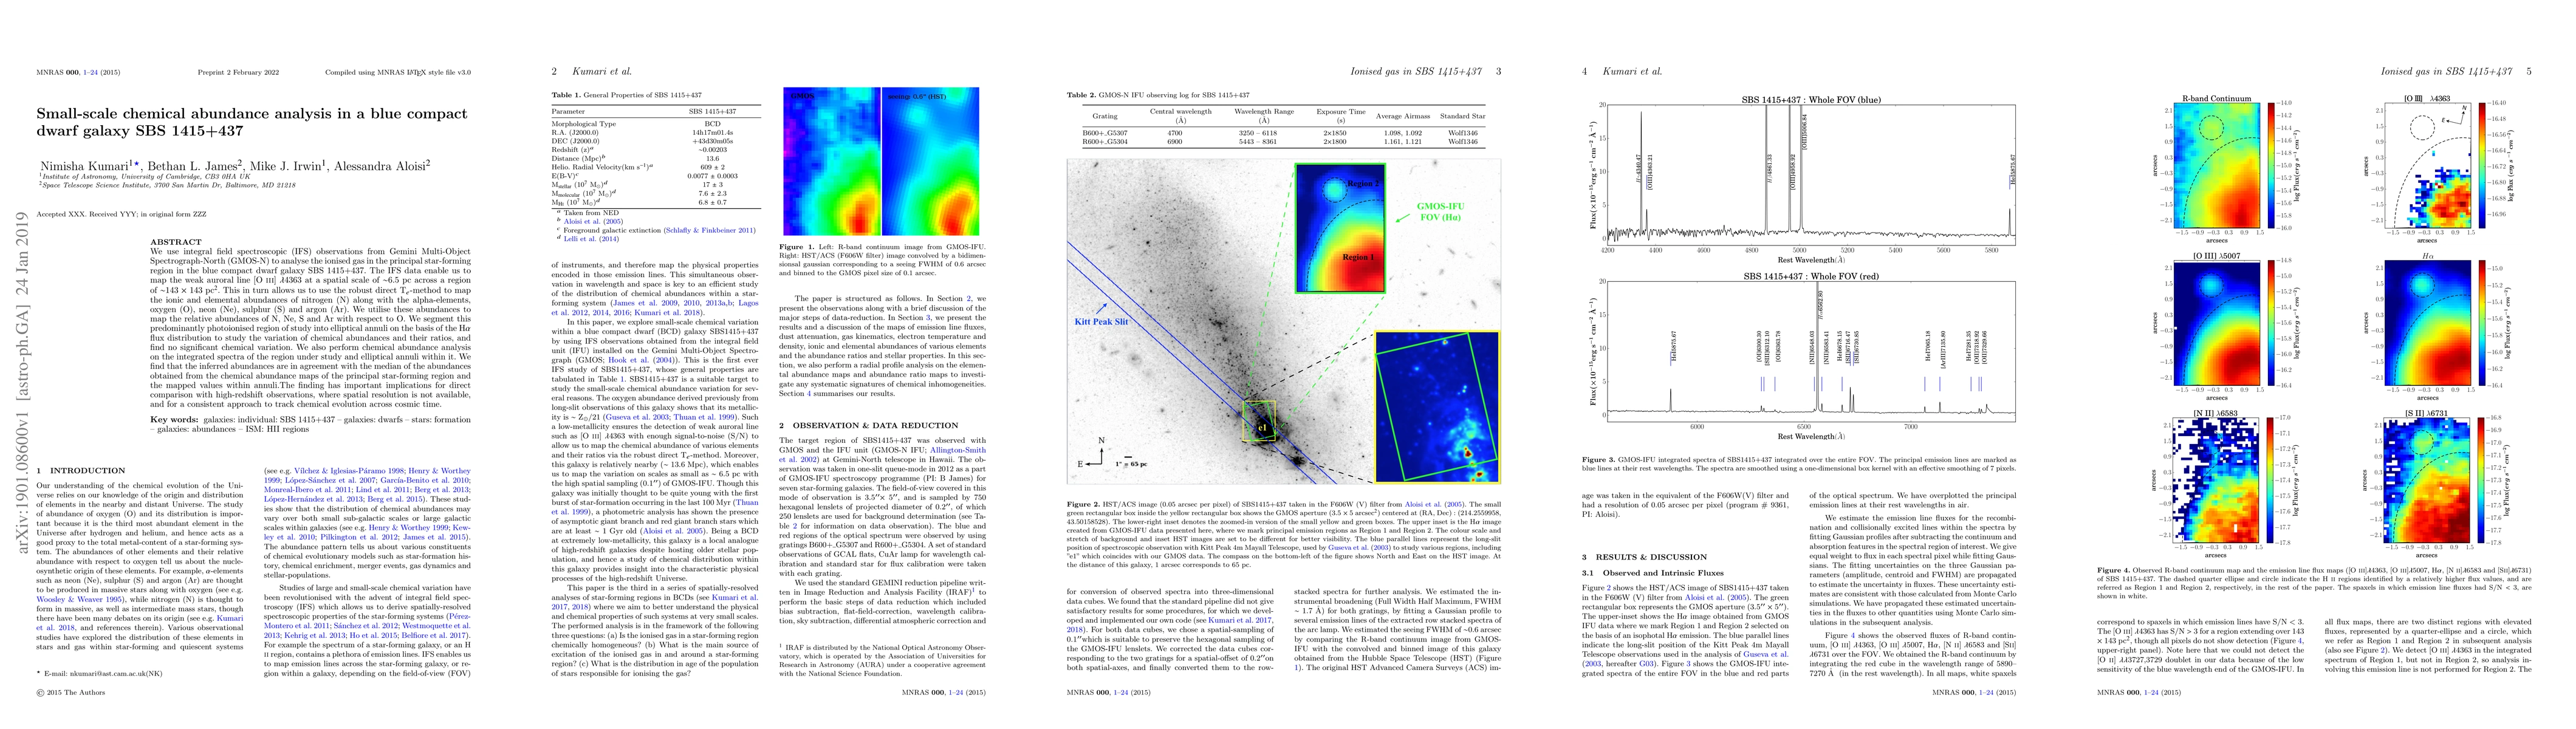
We use integral field spectroscopic (IFS) observations from Gemini Multi-Object Spectrograph-North (GMOS-N) to analyse the ionised gas in the principal star-forming region in the blue compact dwarf galaxy SBS 1415+437. The IFS data enable us to map the weak auroral line [O III] $\lambda$4363 at a spatial scale of $\sim$6.5 pc across a region of $\sim$143 $\times$ 143 pc$^2$. This in turn allows us to use the robust direct T$_e$-method to map the ionic and elemental abundances of nitrogen (N) along with the alpha-elements, oxygen (O), neon (Ne), sulphur (S) and argon (Ar). We utilise these abundances to map the relative abundances of N, Ne, S and Ar with respect to O. We segment this predominantly photoionised region of study into elliptical annuli on the basis of the H$\alpha$ flux distribution to study the variation of chemical abundances and their ratios, and find no significant chemical variation. We also perform chemical abundance analysis on the integrated spectra of the region under study and elliptical annuli within it. We find that the inferred abundances are in agreement with the median of the abundances obtained from the chemical abundance maps of the principal star-forming region and the mapped values within annuli.The finding has important implications for direct comparison with high-redshift observations, where spatial resolution is not available, and for a consistent approach to track chemical evolution across cosmic time.
AI Key Findings
Get AI-generated insights about this paper's methodology, results, and significance.
Paper Details
PDF Preview
Key Terms
Citation Network
Current paper (gray), citations (green), references (blue)
Display is limited for performance on very large graphs.
Similar Papers
Found 4 papers| Title | Authors | Year | Actions |
|---|
Comments (0)