Smart City Data Analysis via Visualization of Correlated Attribute Patterns
Publication
Metrics
Paper Preview
Abstract
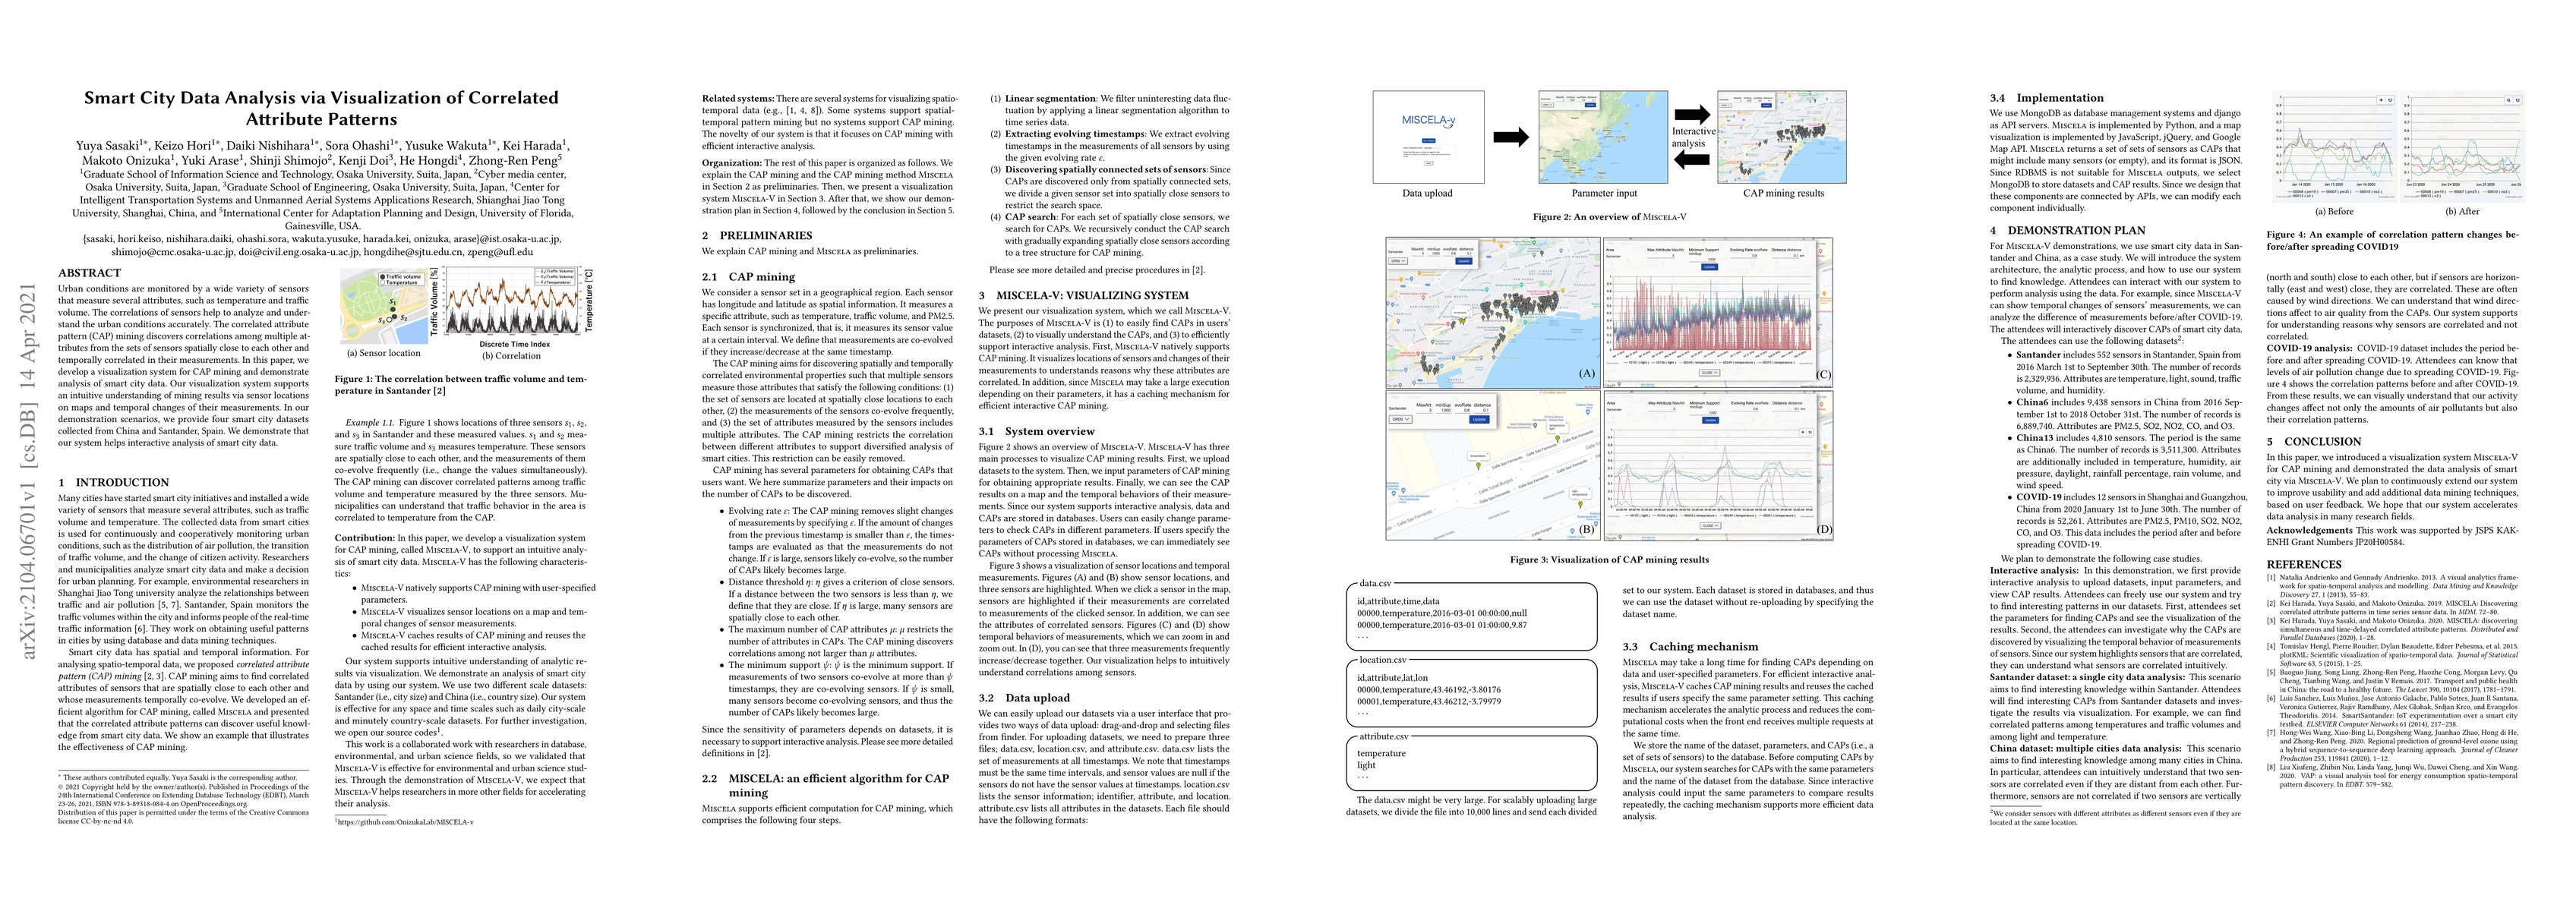
Urban conditions are monitored by a wide variety of sensors that measure several attributes, such as temperature and traffic volume. The correlations of sensors help to analyze and understand the urban conditions accurately. The correlated attribute pattern (CAP) mining discovers correlations among multiple attributes from the sets of sensors spatially close to each other and temporally correlated in their measurements. In this paper, we develop a visualization system for CAP mining and demonstrate analysis of smart city data. Our visualization system supports an intuitive understanding of mining results via sensor locations on maps and temporal changes of their measurements. In our demonstration scenarios, we provide four smart city datasets collected from China and Santander, Spain. We demonstrate that our system helps interactive analysis of smart city data.
AI Key Findings
Get AI-generated insights about this paper's methodology, results, significance, and more — seven facets brought into focus.
Impact
Paper Details
Authors
PDF Preview
Key Terms
Citation Network
Current paper (gray), citations (green), references (blue)
Display is limited for performance on very large graphs.
Discussion 0