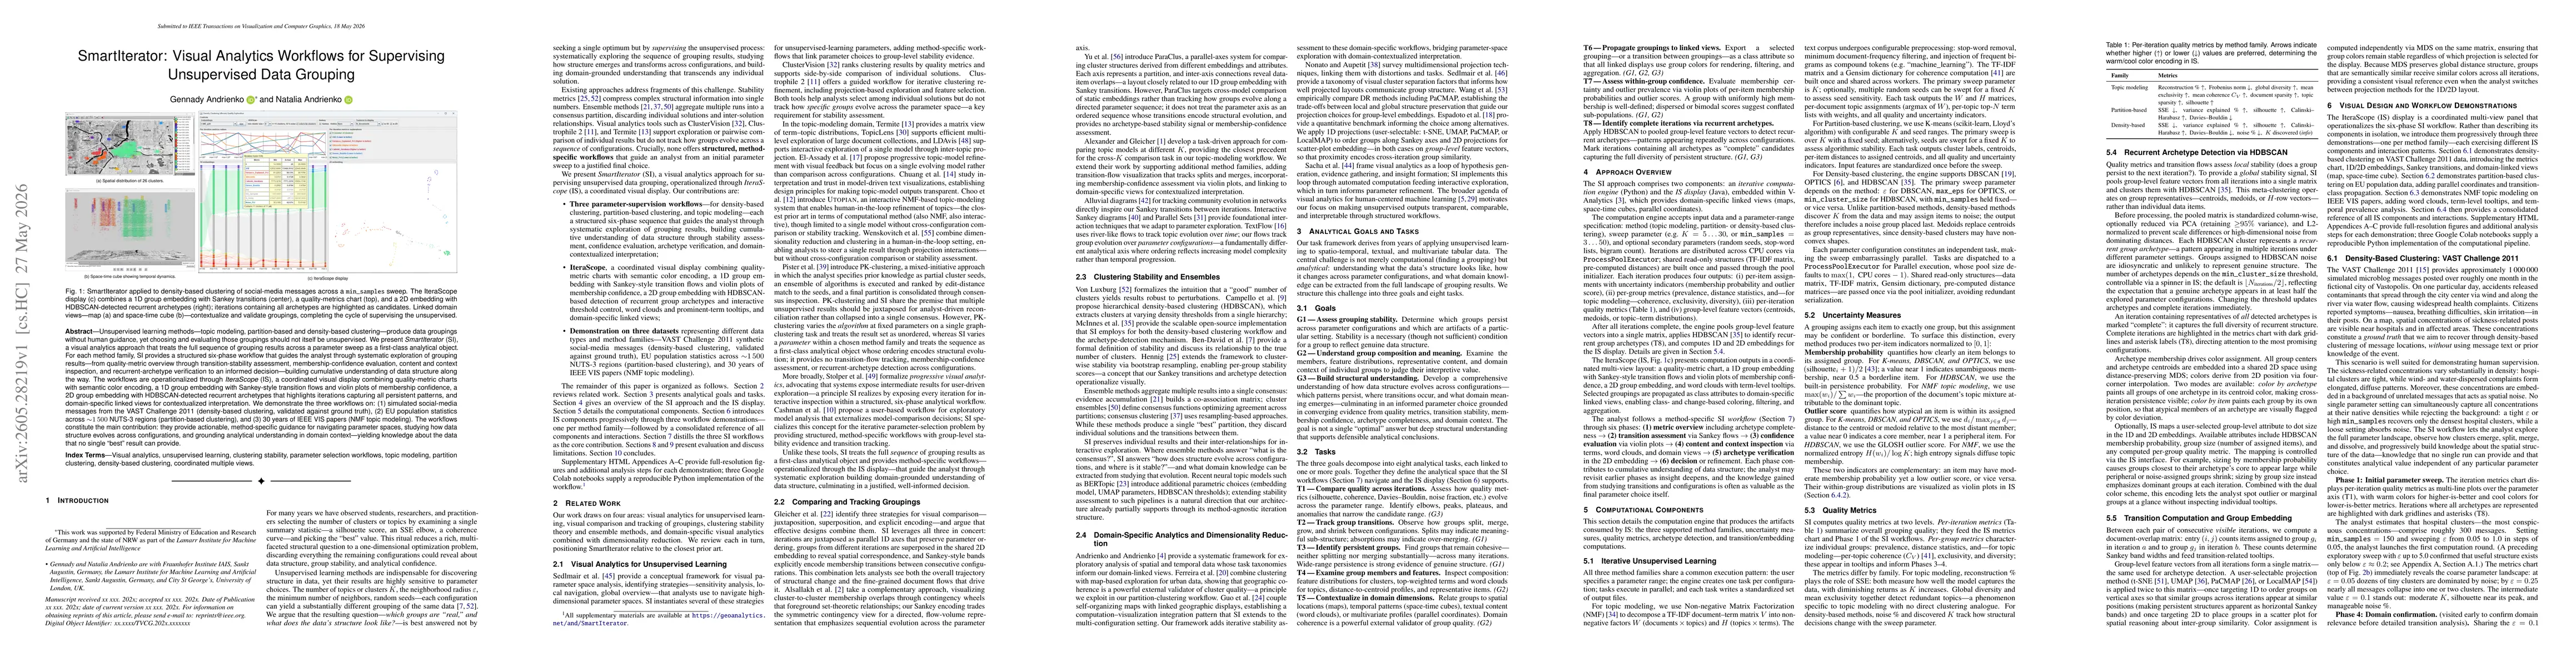
SmartIterator (SI) uses a visual analytics workflow that treats the full sequence of unsupervised grouping results across a parameter sweep as a first-class analytical object. It operationalizes this through IteraScope (IS), a coordinated display combining quality-metric charts, semantic color encoding, 1D and 2D group embeddings with Sankey transitions and recurrent-archetype detection, and domain-specific linked views. The approach provides structured six-phase workflows per method family (density-based clustering, partition-based clustering, and topic modeling) to guide analysts from quality overview through stability, confidence, content/context inspection, and recurrent archetype verification to an informed decision. Demonstrations cover three datasets across different method families to illustrate actionable, method-specific guidance for navigating parameter spaces, observing data structure evolution, and grounding interpretation in domain context.
SmartIterator: Visual Analytics Workflows for Supervising Unsupervised Data Grouping
Publication
Metrics
AI Quick Summary
SmartIterator (SI) treats the sequence of clustering results across parameter sweeps as a core analytical object, guiding users through a six-phase workflow to explore and validate unsupervised groupings. Its IteraScope visualization tools couple quality metrics, transition patterns, and domain context to help non-experts understand data structure across methods and configurations, yielding actionable insights that no single best result can provide.
Quick Answers
What is "SmartIterator: Visual Analytics Workflows for Supervising Unsupervised Data Grouping" about?
SmartIterator (SI) treats the sequence of clustering results across parameter sweeps as a core analytical object, guiding users through a six-phase workflow to explore and validate unsupervised groupings. Its IteraScope visualization tools couple quality metrics, transition patterns, and domain context to help non-experts understand data structure across methods and configurations, yielding actionable insights that no single best result can provide.
What methodology did the authors use?
SmartIterator (SI) uses a visual analytics workflow that treats the full sequence of unsupervised grouping results across a parameter sweep as a first-class analytical object. It operationalizes this through IteraScope (IS), a coordinated display combining quality-metric charts, semantic color encoding, 1D and 2D group embeddings with Sankey transitions and recurrent-archetype detection, and domain-specific linked views. The approach provides structured six-phase... More in Methodology →
What are the key results?
The six-phase SI workflows enable systematic exploration of grouping results, revealing stability trends and transitions across parameter sweeps that single-metric summaries miss. — IS visually encodes quality metrics, transitions, and membership confidence in an integrated layout, improving interpretability of multi-configuration results across density-based, partition-based, and NMF topic modeling tasks. More in Key Results →
Why is this work significant?
The work contributes a structured, method-specific, visual analytics workflow that treats the entire configuration space as a coherent analytical object, enabling human-guided, evidence-based selection of unsupervised groupings rather than relying on a single best result. More in Significance →
What are the main limitations?
Demonstrations are limited to three method families and may not generalize to all unsupervised paradigms or extremely large parameter spaces without scaling adaptations. — The approach relies on quality-metric definitions and domain-linked views that may require substantial customization for new domains or datasets. More in Limitations →
Paper Preview
Abstract
Unsupervised learning methods -- topic modeling, partition-based and density-based clustering -- produce data groupings without human guidance, yet choosing and evaluating those groupings should not itself be unsupervised. We present \emph{SmartIterator}~(SI), a visual analytics approach that treats the full sequence of grouping results across a parameter sweep as a first-class analytical object. For each method family, SI provides a structured six-phase workflow that guides the analyst through systematic exploration of grouping results -- from quality-metric overview through transition-stability assessment, membership-confidence evaluation, content and context inspection, and recurrent-archetype verification to an informed decision -- building cumulative understanding of data structure along the way. The workflows are operationalized through \emph{IteraScope}~(IS), a coordinated visual display combining quality-metric charts with semantic color encoding, a 1D group embedding with Sankey-style transition flows and violin plots of membership confidence, a 2D group embedding with HDBSCAN-detected recurrent archetypes that highlights iterations capturing all persistent patterns, and domain-specific linked views for contextualized interpretation. We demonstrate the three workflows on: (1)~simulated social-media messages from the VAST Challenge 2011 (density-based clustering, validated against ground truth), (2)~EU population statistics across ${\sim}1\,500$ NUTS-3 regions (partition-based clustering), and (3)~30 years of IEEE VIS papers (NMF topic modeling). The workflows constitute the main contribution: they provide actionable, method-specific guidance for navigating parameter spaces, studying how data structure evolves across configurations, and grounding analytical understanding in domain context -- yielding knowledge about the data that no single ``best'' result can provide.
Key Findings, in focus
Seven facets of this paper, analysed and brought into focus by AI.
The work contributes a structured, method-specific, visual analytics workflow that treats the entire configuration space as a coherent analytical object, enabling human-guided, evidence-based selection of unsupervised groupings rather than relying on a single best result.
- The six-phase SI workflows enable systematic exploration of grouping results, revealing stability trends and transitions across parameter sweeps that single-metric summaries miss.
- IS visually encodes quality metrics, transitions, and membership confidence in an integrated layout, improving interpretability of multi-configuration results across density-based, partition-based, and NMF topic modeling tasks.
- Recurrent archetypes detected by the 2D embedding (via HDBSCAN) highlight iterations capturing persistent patterns, aiding robust decision-making about data structure.
- Domain-linked views provide contextual validation of groupings, grounding analytical insights in real-world interpretations and improving trust in selected configurations.
The work contributes a structured, method-specific, visual analytics workflow that treats the entire configuration space as a coherent analytical object, enabling human-guided, evidence-based selection of unsupervised groupings rather than relying on a single best result.
Introduction of SmartIterator (SI) as a visual analytics framework with a six-phase, method-specific workflow and IteraScope (IS) display that jointly visualizes quality metrics, parameter transitions, 1D/2D embeddings, recurrent archetypes, and domain-linked context for supervising unsupervised data grouping across parameter sweeps.
First-class treatment of the complete sequence of unsupervised configurations as analytical objects, offering structured, method-specific six-phase workflows and coordinated multi-view visualization that tracks stability, transitions, confidence, and domain context across the parameter space.
- Demonstrations are limited to three method families and may not generalize to all unsupervised paradigms or extremely large parameter spaces without scaling adaptations.
- The approach relies on quality-metric definitions and domain-linked views that may require substantial customization for new domains or datasets.
- Interpretability may depend on user expertise in visual analytics and clustering validity concepts, potentially affecting adoption in non-specialist settings.
- Extend scalability to very large datasets with optimized embedding and interaction strategies to maintain responsiveness across extensive parameter sweeps.
- Automate guidance for parameter sweep design by integrating uncertainty-based suggestions and active learning cues within the six-phase workflow.
- Expand domain-agnostic linked views and extend support for additional unsupervised methods (e.g., spectral clustering, graph-based methods) within the SI framework.
Discussion 0