Social Analytics of Team Interaction using Dynamic Complexity Heat Maps and Network Visualizations
Publication
Metrics
AI Quick Summary
This paper combines sensor-based social analytics with Dynamic Complexity Heat Maps and Network Visualizations to understand team interaction dynamics. The study reveals transitions in task and team communication, and structural changes in team member engagement, demonstrating a method to optimize team effectiveness.
Paper Preview
Abstract
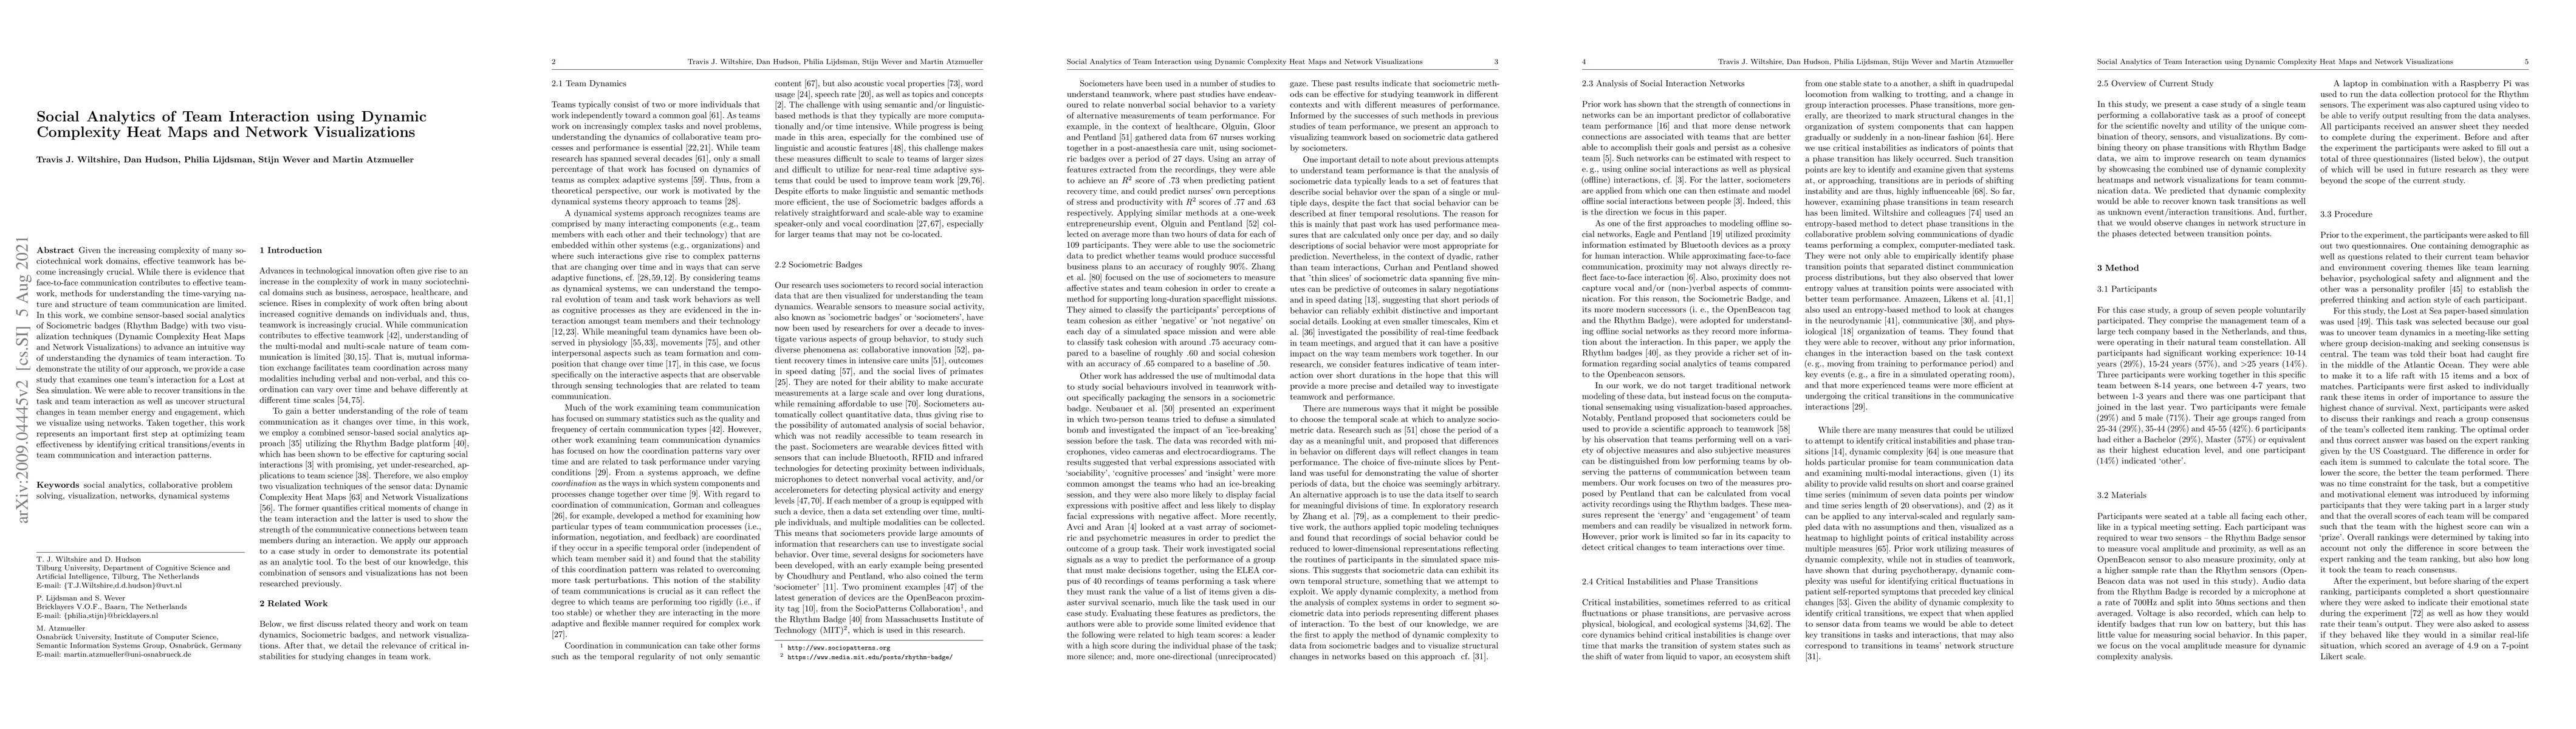
Given the increasing complexity of many sociotechnical work domains, effective teamwork has become increasingly crucial. While there is evidence that face-to-face communication contributes to effective teamwork, methods for understanding the time-varying nature and structure of team communication are limited. In this work, we combine sensor-based social analytics of Sociometric badges (Rhythm Badge) with two visualization techniques (Dynamic Complexity Heat Maps and Network Visualizations) to advance an intuitive way of understanding the dynamics of team interaction. To demonstrate the utility of our approach, we provide a case study that examines one team's interaction for a Lost at Sea simulation. We were able to recover transitions in the task and team interaction as well as uncover structural changes in team member energy and engagement, which we visualize using networks. Taken together, this work represents an important first step at optimizing team effectiveness by identifying critical transitions/events in team communication and interaction patterns.
AI Key Findings
Get AI-generated insights about this paper's methodology, results, significance, and more — seven facets brought into focus.
Impact
Paper Details
PDF Preview
Key Terms
Citation Network
Current paper (gray), citations (green), references (blue)
Display is limited for performance on very large graphs.
Discussion 0