Publication
Metrics
AI Quick Summary
This research employs color-coded magnetograms to visualize the evolution of solar active regions and their potential flaring activity. The study finds that these visual tools effectively track the transition of magnetic fields, highlighting strong horizontal fields as precursors to flaring, thus aiding in flare prediction.
Paper Preview
Abstract
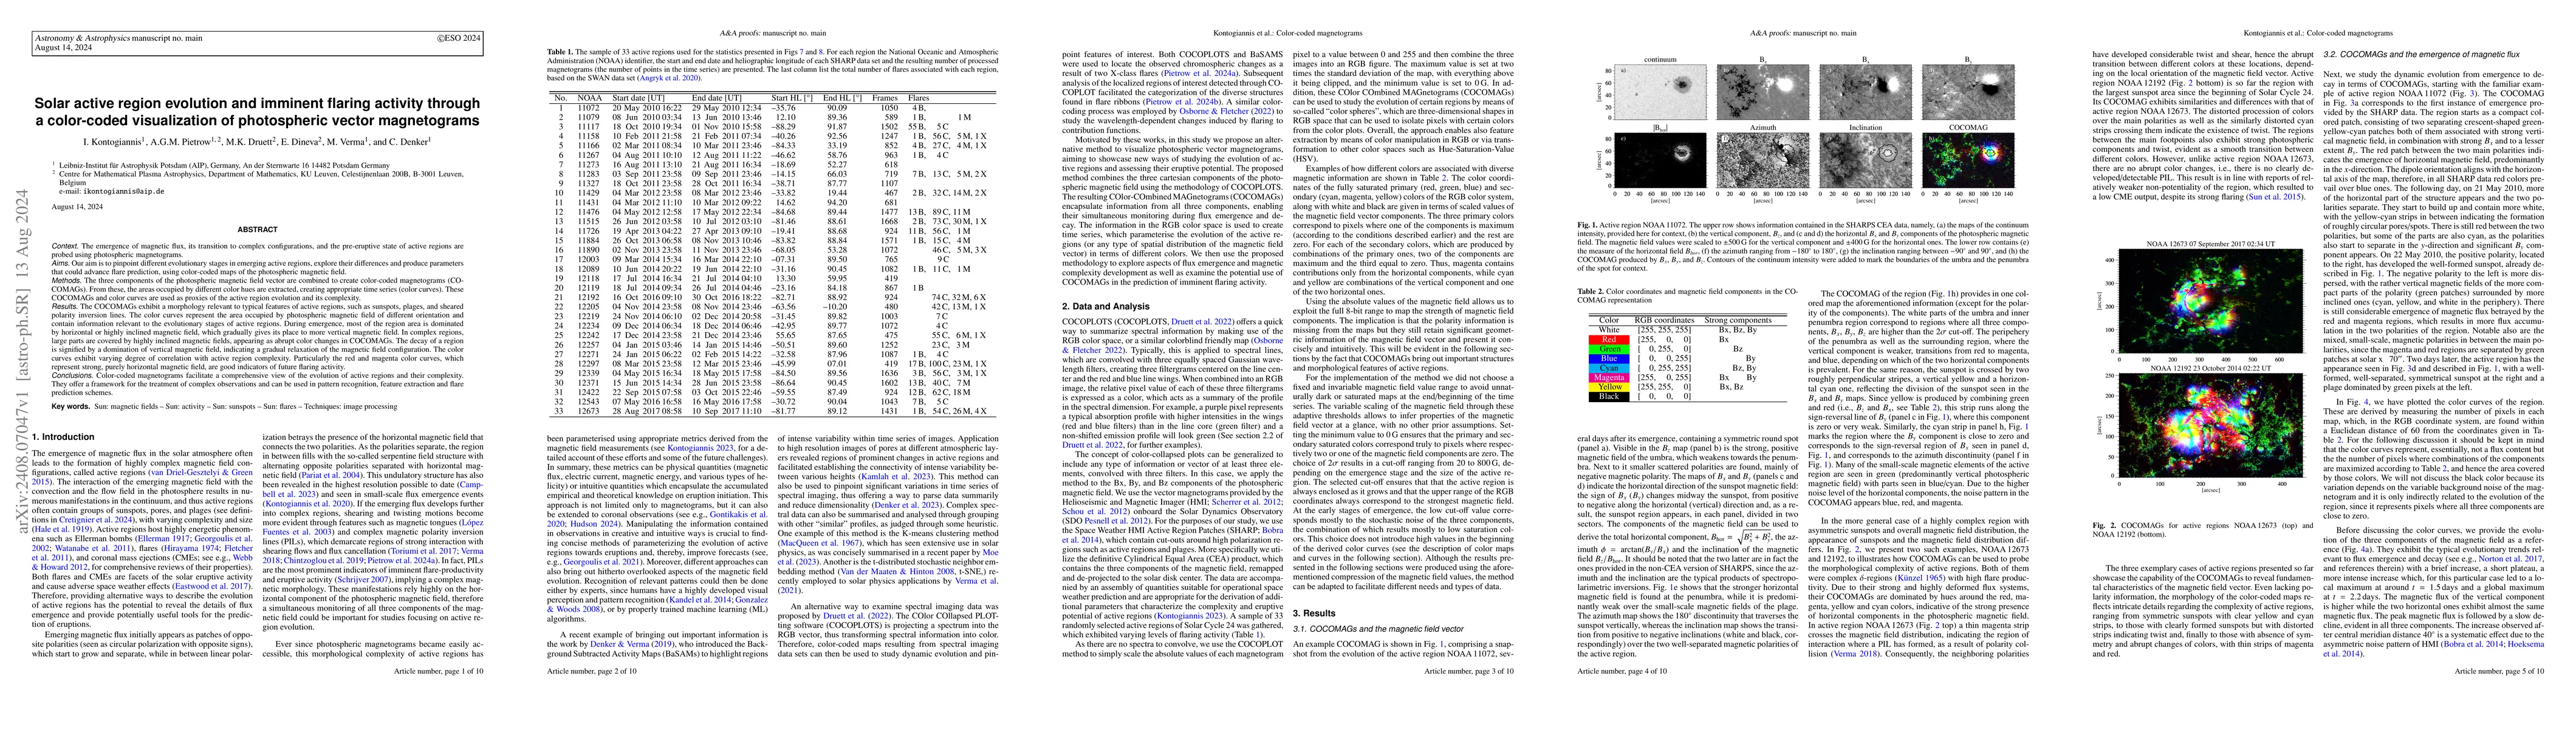
The emergence of magnetic flux, its transition to complex configurations, and the pre-eruptive state of active regions are probed using photospheric magnetograms. We aim to pinpoint different evolutionary stages in active regions, explore their differences and produce parameters that could advance flare prediction, using color-coded maps of the photospheric magnetic field. The three components of the photospheric magnetic field vector are combined in color-coded magnetograms (COCOMAGs). From these, the areas occupied by different colors are extracted, creating appropriate time series (color curves). The COCOMAGs and color curves are used as proxies of the active region evolution and complexity. The COCOMAGs morphology reflects typical features of active regions, such as sunspots, plages, and sheared polarity inversion lines. The color curves represent the area occupied by photospheric magnetic field of different orientation and contain information relevant to the evolutionary stages of active regions. During emergence, most of the area is dominated by horizontal or highly inclined magnetic field, which gradually gives its place to more vertical magnetic field. In complex regions, large parts are covered by highly inclined magnetic fields, appearing as abrupt color changes. Active region decay is signified by a domination of vertical magnetic field, indicating a gradual relaxation of the magnetic field configuration. The color curves exhibit varying degree of correlation with active region complexity. The red and magenta color curves, which represent strong, purely horizontal magnetic field, are good indicators of future flaring. Color-coded magnetograms facilitate a comprehensive view of the evolution of active regions and their complexity. They offer a framework for the treatment of complex observations and can be used in pattern recognition, feature extraction and flare prediction.
AI Key Findings
Get AI-generated insights about this paper's methodology, results, significance, and more — seven facets brought into focus.
Impact
Paper Details
Authors
PDF Preview
Citation Network
Current paper (gray), citations (green), references (blue)
Display is limited for performance on very large graphs.
Discussion 0