Summary
We developed an efficient algorithm integrated in our 3D modeling tool, GX Simulator (Nita et al. 2015), allowing quick computation of the synthetic intensity and polarization maps of solar active regions (AR) in the ALMA spectral range. The algorithm analyzes the photospheric input (white light and magnetogram) to classify a given photospheric pixel to belong to a given photospheric structure. Then, a 1D chromospheric model (Fontenla et al. 2009) is added on top of each pixel, which forms a chromospheric model of the AR. Next step is computation of the mm and sub-mm emission produced from this chromosphere model. A huge advantage of this approach is that emission from any given AR can be synthesized very fast, on the order of a few minutes after the AR selection. Using the GX Simulator tool it is also possible to produce synthetic maps of the microwave (gyroresonance) and EUV emission from the same AR model and compare them with the ALMA synthetic maps and with the corresponding observed microwave and/or EUV data.
AI Key Findings
Get AI-generated insights about this paper's methodology, results, and significance.
Paper Details
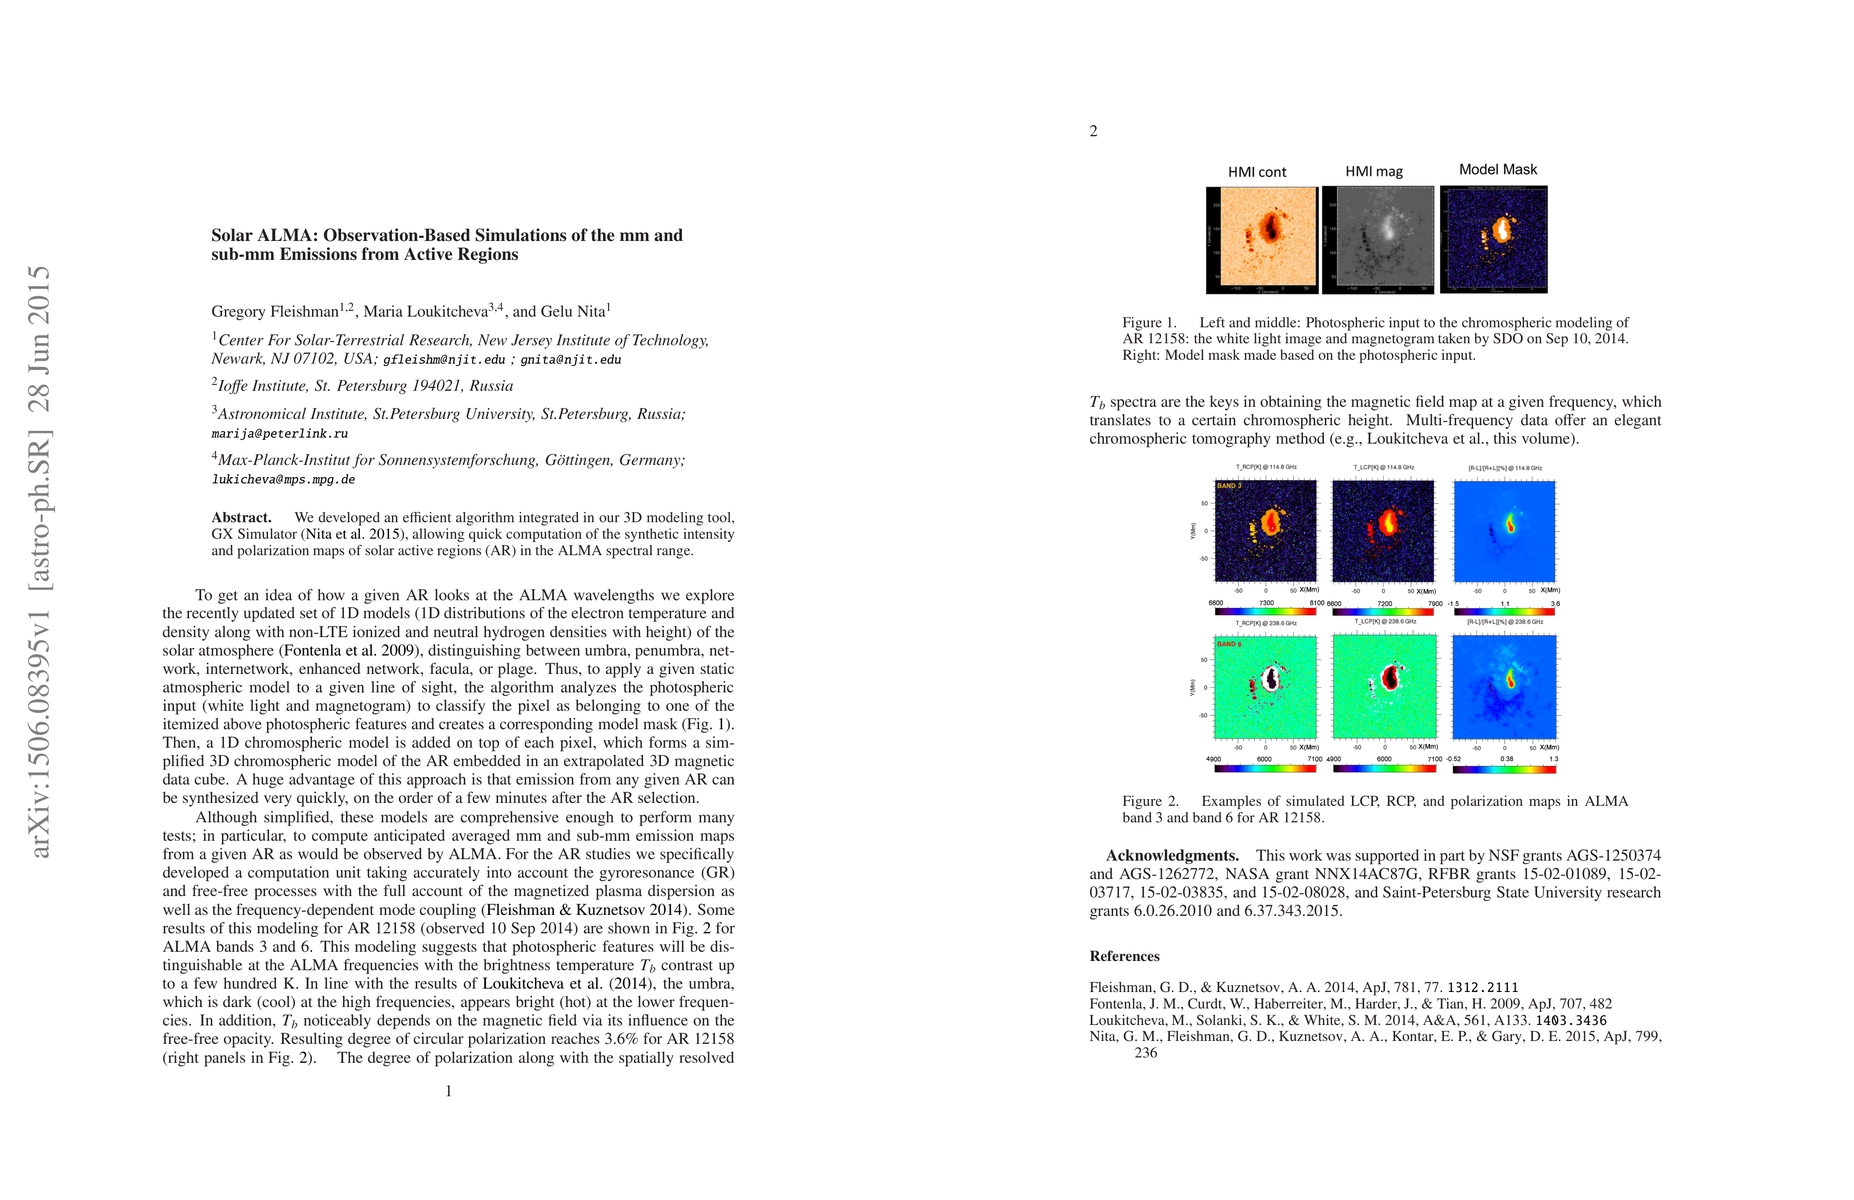
PDF Preview
Key Terms
Citation Network
Current paper (gray), citations (green), references (blue)
Display is limited for performance on very large graphs.
Similar Papers
Found 4 papers| Title | Authors | Year | Actions |
|---|
Comments (0)