Publication
Metrics
AI Quick Summary
This study investigates the spectral properties of solar flare ribbon fronts using IRIS satellite data, revealing peculiar line profiles indicative of different heating regimes. The analysis suggests that gradual non-thermal electron fluxes cause the observed chromospheric absorption, while stronger, impulsive energy fluxes drive transition region emission and chromospheric evaporation.
Paper Preview
Abstract
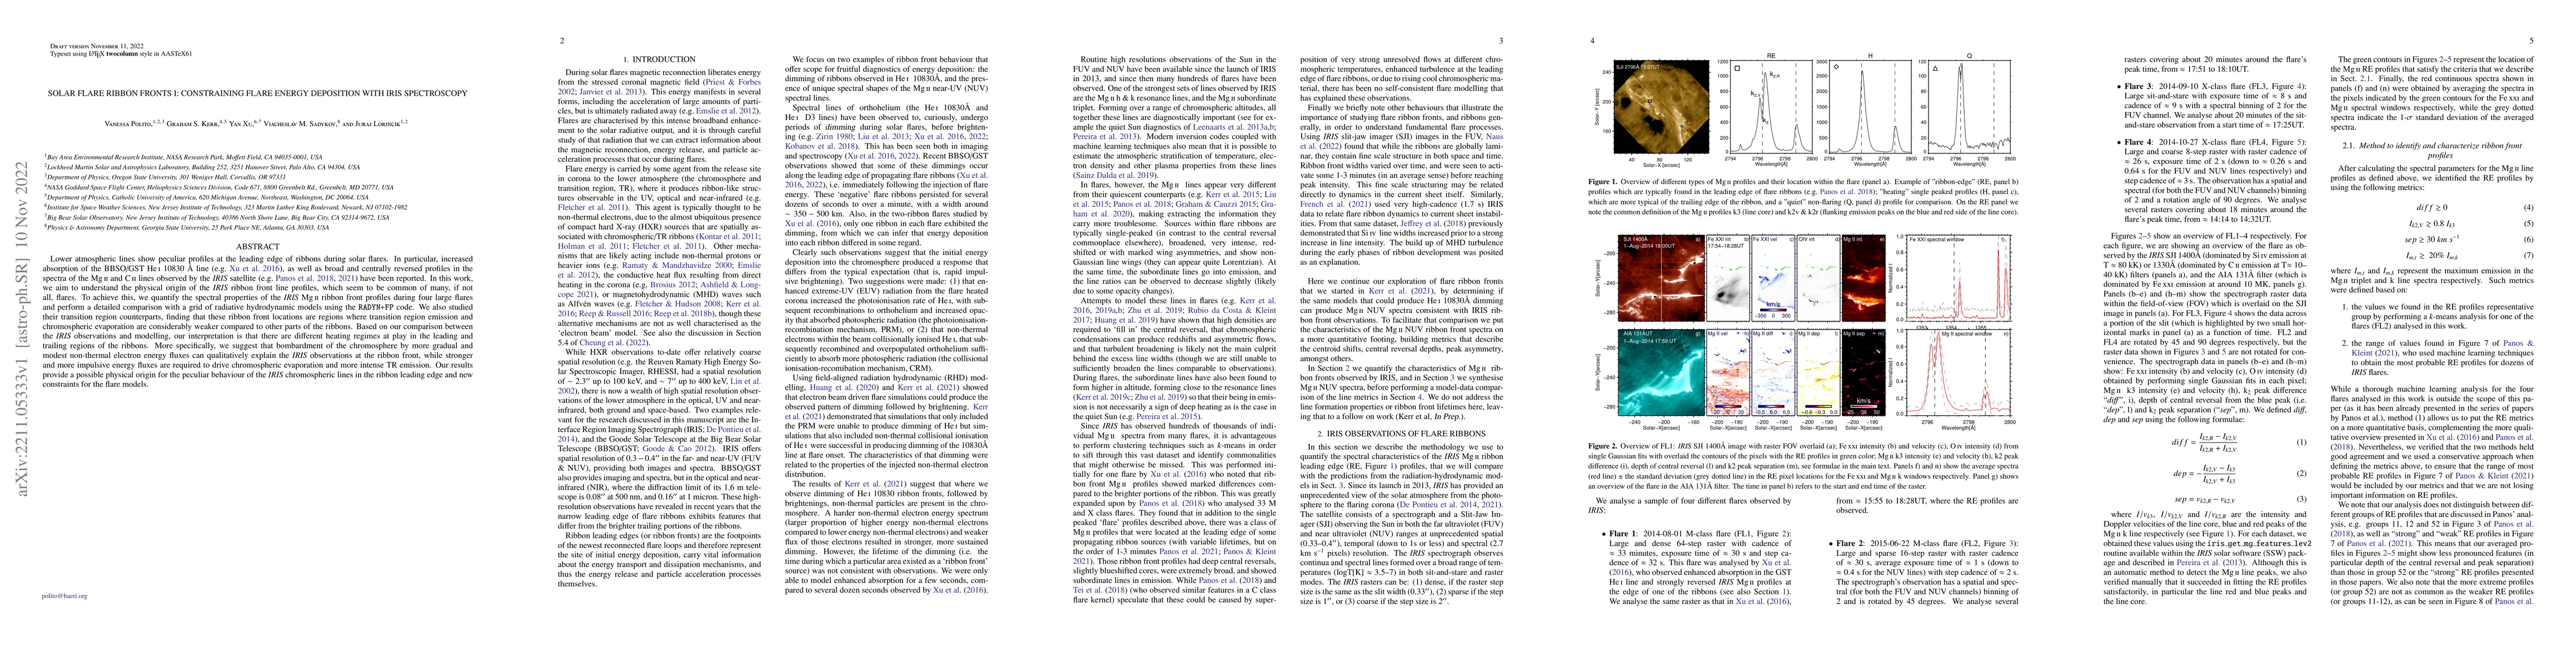
Lower atmospheric lines show peculiar profiles at the leading edge of ribbons during solar flares. In particular, increased absorption of the BBSO/GST \hei~10830~\AA\ line \citep[e.g.][]{Xu2016}, as well as broad and centrally reversed profiles in the spectra of the \mgii~and \cii~lines observed by the \iris~satellite \citep[e.g.][]{Panos2018,Panos2021a} have been reported. In this work, we aim to understand the physical origin of the \iris\ ribbon front line profiles, which seem to be common of many, if not all, flares. To achieve this, we quantify the spectral properties of the \iris~\mgii~ribbon front profiles during four large flares and perform a detailed comparison with a grid of radiative hydrodynamic models using the \radynfp~code. We also studied their transition region counterparts, finding that these ribbon front locations are regions where transition region emission and chromospheric evaporation are considerably weaker compared to other parts of the ribbons. Based on our comparison between the \iris~observations and modelling, our interpretation is that there are different heating regimes at play in the leading and trailing regions of the ribbons. More specifically, we suggest that bombardment of the chromosphere by more gradual and modest non-thermal electron energy fluxes can qualitatively explain the \iris~observations at the ribbon front, while stronger and more impulsive energy fluxes are required to drive chromospheric evaporation and more intense TR emission. Our results provide a possible physical origin for the peculiar behaviour of the \iris~chromospheric lines in the ribbon leading edge and new constraints for the flare models.
AI Key Findings
Get AI-generated insights about this paper's methodology, results, significance, and more — seven facets brought into focus.
Impact
Paper Details
Authors
PDF Preview
Key Terms
Citation Network
Current paper (gray), citations (green), references (blue)
Display is limited for performance on very large graphs.
Discussion 0