Solar-like oscillations in low-luminosity red giants: first results from Kepler

Source: ArXiv

AI Quick Summary

This study uses Kepler Mission's time-series photometry to detect solar-like oscillations in low-luminosity red giants, revealing clear oscillation patterns and confirming a correlation between oscillation parameters. The analysis highlights mixed modes and broadened ridges for l=1, indicating the potential of Kepler data for detailed red giant asteroseismology.

Share: Share on X LinkedIn

Summary

We have measured solar-like oscillations in red giants using time-series photometry from the first 34 days of science operations of the Kepler Mission. The light curves, obtained with 30-minute sampling, reveal clear oscillations in a large sample of G and K giants, extending in luminosity from the red clump down to the bottom of the giant branch. We confirm a strong correlation between 
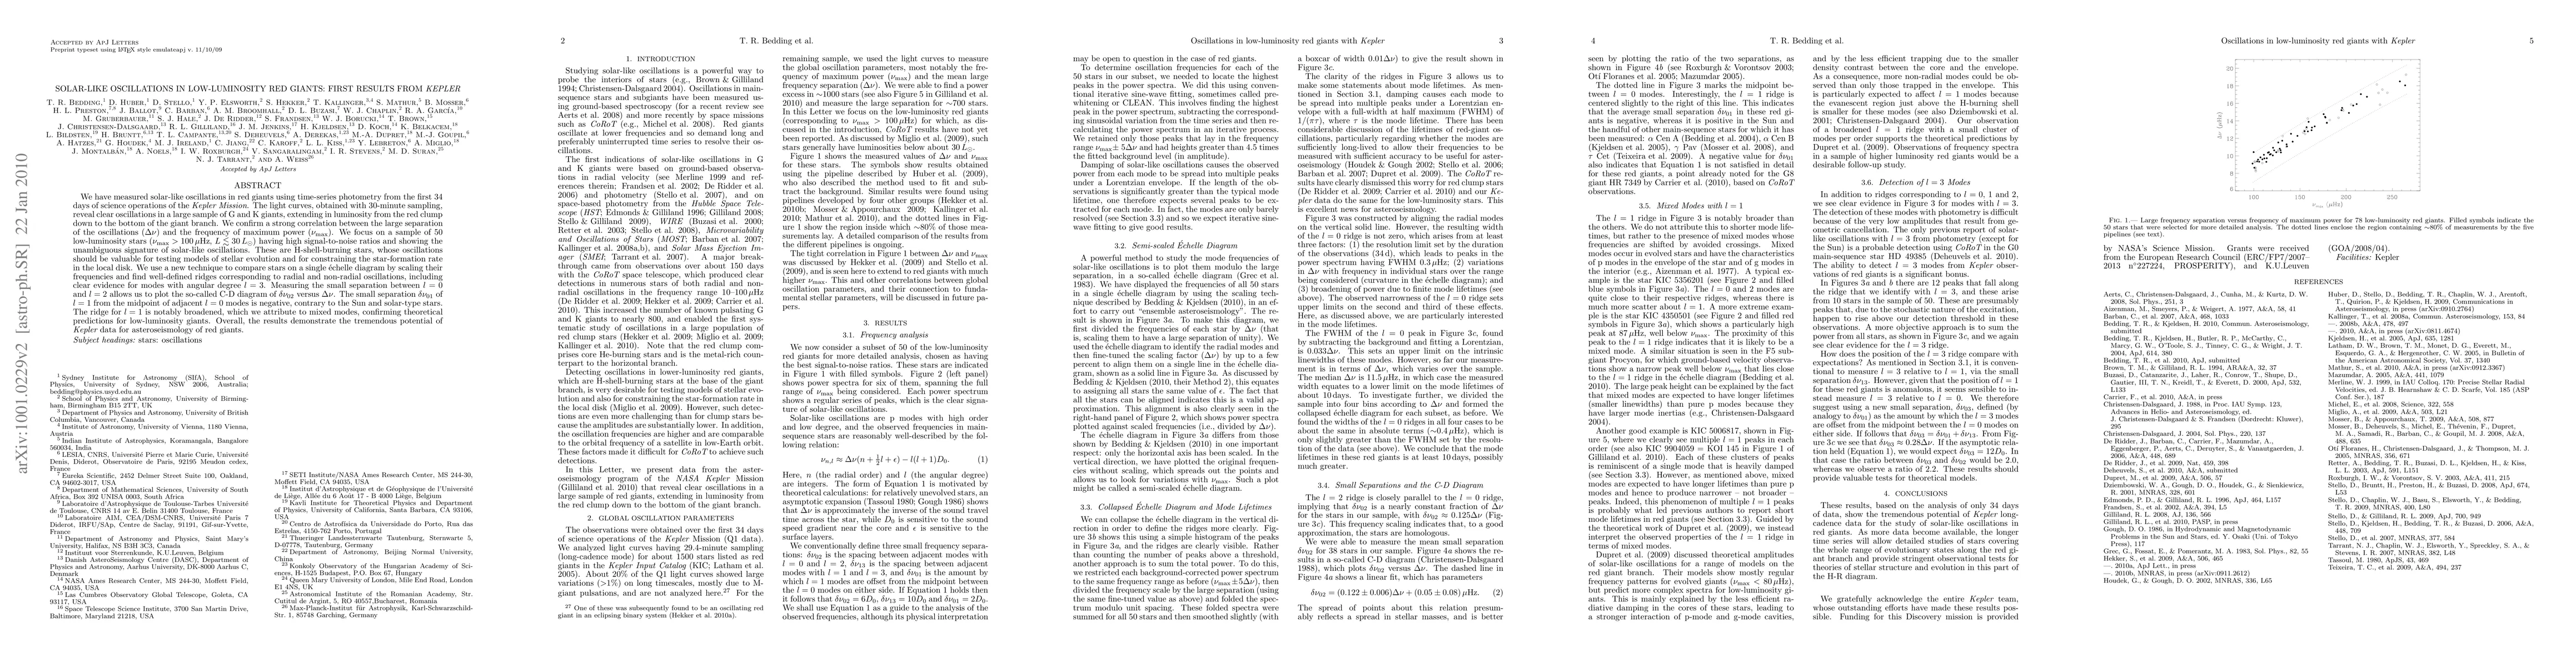
the large separation of the oscillations (Delta nu) and the frequency of maximum power (nu_max). We focus on a sample of 50 low-luminosity stars (nu_max > 100 muHz, L <~ 30 L_sun) having high signal-to-noise ratios and showing the unambiguous signature of solar-like oscillations. These are H-shell-burning stars, whose oscillations should be valuable for testing models of stellar evolution and for constraining the star-formation rate in the local disk. We use a new technique to compare stars on a single echelle diagram by scaling their frequencies and find well-defined ridges corresponding to radial and non-radial oscillations, including clear evidence for modes with angular degree l=3. Measuring the small separation between l=0 and l=2 allows us to plot the so-called C-D diagram of delta nu_02 versus Delta nu. The small separation delta nu_01 of l=1 from the midpoint of adjacent l=0 modes is negative, contrary to the Sun and solar-type stars. The ridge for l=1 is notably broadened, which we attribute to mixed modes, confirming theoretical predictions for low-luminosity giants. Overall, the results demonstrate the tremendous potential of Kepler data for asteroseismology of red giants.

AI Key Findings

Generated Sep 02, 2025

Methodology

The research utilized time-series photometry from the first 34 days of Kepler Mission operations, analyzing light curves with 30-minute sampling for solar-like oscillations in G and K giants, ranging from the red clump to the bottom of the giant branch.

Key Results

  • Clear detection of solar-like oscillations in a large sample of low-luminosity red giants (L <~ 30 L_sun) with nu_max > 100 μHz.
  • Strong correlation observed between the large separation of oscillations (Delta nu) and the frequency of maximum power (nu_max).
  • Identification of radial and non-radial oscillations, including evidence for modes with angular degree l=3, using a new scaling technique to compare stars on a single echelle diagram.
  • Negative small separation (delta nu_01) for l=1 modes in red giants, contrary to the Sun and solar-type stars, indicating mixed modes.
  • Broadened l=1 ridge attributed to mixed modes, confirming theoretical predictions for low-luminosity giants.

Significance

This research demonstrates the potential of Kepler data for asteroseismology of red giants, providing valuable insights into stellar evolution models and constraining the star-formation rate in the local disk.

Technical Contribution

Development and application of a new technique for scaling frequencies and comparing stars on a single echelle diagram, enabling clear identification of radial and non-radial oscillations, including l=3 modes.

Novelty

First results from the Kepler Mission to report on solar-like oscillations in low-luminosity red giants, providing crucial data for testing stellar evolution models and understanding stellar interior structures.

Limitations

  • Analysis based on only 34 days of Kepler data.
  • Limited to low-luminosity red giants, so findings may not generalize to higher-luminosity giants.

Future Work

  • Extend the analysis with more Kepler data to study a broader range of red giant evolutionary stages.
  • Investigate higher-luminosity red giants to compare and contrast findings with low-luminosity giants.

Paper Details

PDF Preview

Download PDF

Key Terms

oscillations (0.244)
oscillations (0.242)
red (0.203)
red (0.200)
kepler (0.196)
kepler (0.195)
delta (0.188)
delta (0.184)
Title Authors Year Actions

Comments (0)

This website uses cookies to ensure you get the best experience. Learn more