Solving peak overlaps for proximity histogram analysis of complex interfaces for atom probe tomography data
Publication
Metrics
Paper Preview
Abstract
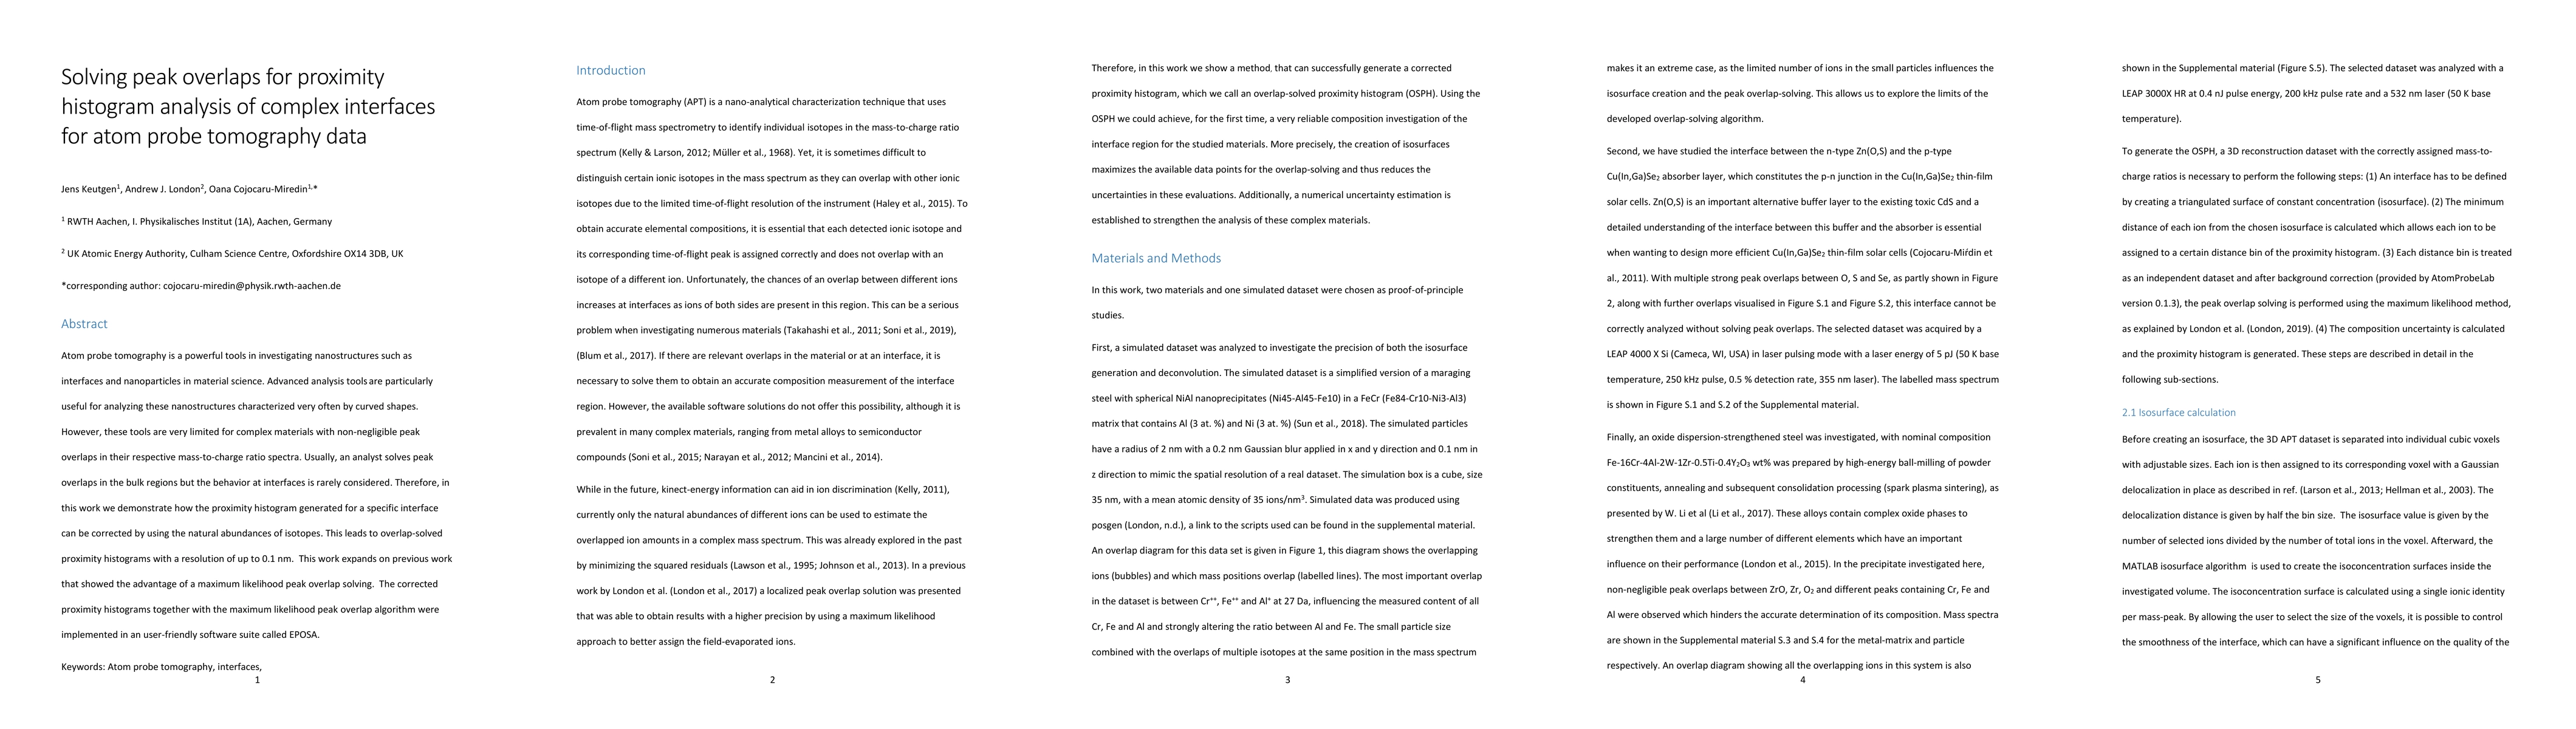
Atom probe tomography is a powerful tools in investigating nanostructures such as interfaces and nanoparticles in material science. Advanced analysis tools are particularly useful for analyzing these nanostructures characterized very often by curved shapes. However, these tools are very limited for complex materials with non-negligible peak overlaps in their respective mass-to-charge ratio spectra. Usually, an analyst solves peak overlaps in the bulk regions but the behavior at interfaces is rarely considered. Therefore, in this work we demonstrate how the proximity histogram generated for a specific interface can be corrected by using the natural abundances of isotopes. This leads to overlap-solved proximity histograms with a resolution of up to 0.1 nm. This work expands on previous work that showed the advantage of a maximum likelihood peak overlap solving. The corrected proximity histograms together with the maximum likelihood peak overlap algorithm were implemented in an user-friendly software suite called EPOSA.
AI Key Findings
Get AI-generated insights about this paper's methodology, results, significance, and more — seven facets brought into focus.
Impact
Paper Details
Authors
PDF Preview
Key Terms
Citation Network
Current paper (gray), citations (green), references (blue)
Display is limited for performance on very large graphs.
Discussion 0