Solving the Brachistochrone Problem by an Influence Diagram
1702.02032
Published Feb 8, 2017
1 citations
Publication
Published:
Feb 08, 2017
Updated:
Jun 08, 2025
Categories:
math.OC, cs.AI
Metrics
Citations:
1
Source:
ArXiv
Paper Preview
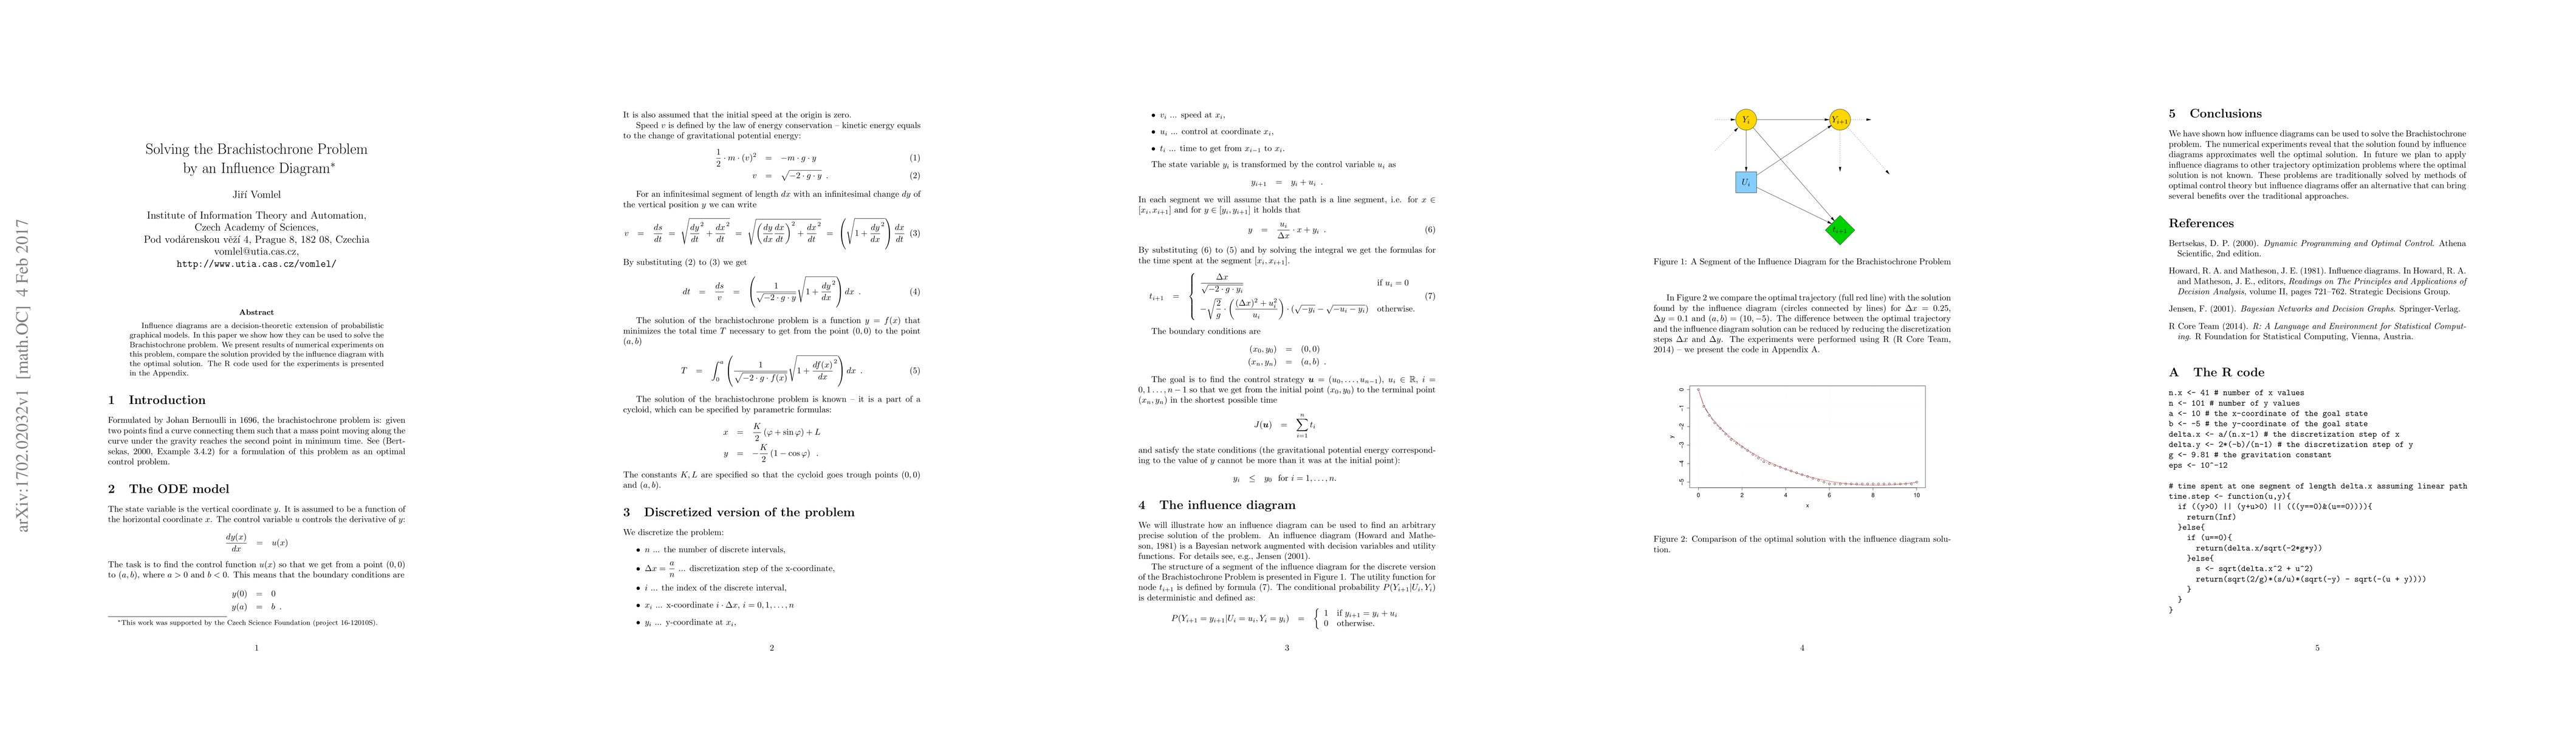
Abstract
Influence diagrams are a decision-theoretic extension of probabilistic graphical models. In this paper we show how they can be used to solve the Brachistochrone problem. We present results of numerical experiments on this problem, compare the solution provided by the influence diagram with the optimal solution. The R code used for the experiments is presented in the Appendix.
AI Key Findings
Get AI-generated insights about this paper's methodology, results, significance, and more — seven facets brought into focus.
Impact
1
Citations
4
References
Paper Details
Paper ID:
1702.02032
License:
http://arxiv.org/licenses/nonexclusive-distrib/1.0/
Comments:
8 pages, 2 figures
Categories:
math.OC
cs.AI
PDF Preview
Key Terms
influence
(0.333)
graphical
(0.262)
optimal solution
(0.254)
solution
(0.241)
diagrams
(0.225)
experiments
(0.222)
numerical experiments
(0.219)
theoretic
(0.215)
Citation Network
Current paper (gray), citations (green), references (blue)
Display is limited for performance on very large graphs.
Current Paper
Citations
References
Click to view
Discussion 0