Some ideas about graphic representations of discrete fuzzy measures
Publication
Metrics
AI Quick Summary
This paper explores the use of graphs to visualize discrete fuzzy measures, discussing their properties like duality and nonadditivity, and presenting graphical representations of various special fuzzy measures and nonlinear integrals, along with methods for fitting and comparing fuzzy measures.
Paper Preview
Abstract
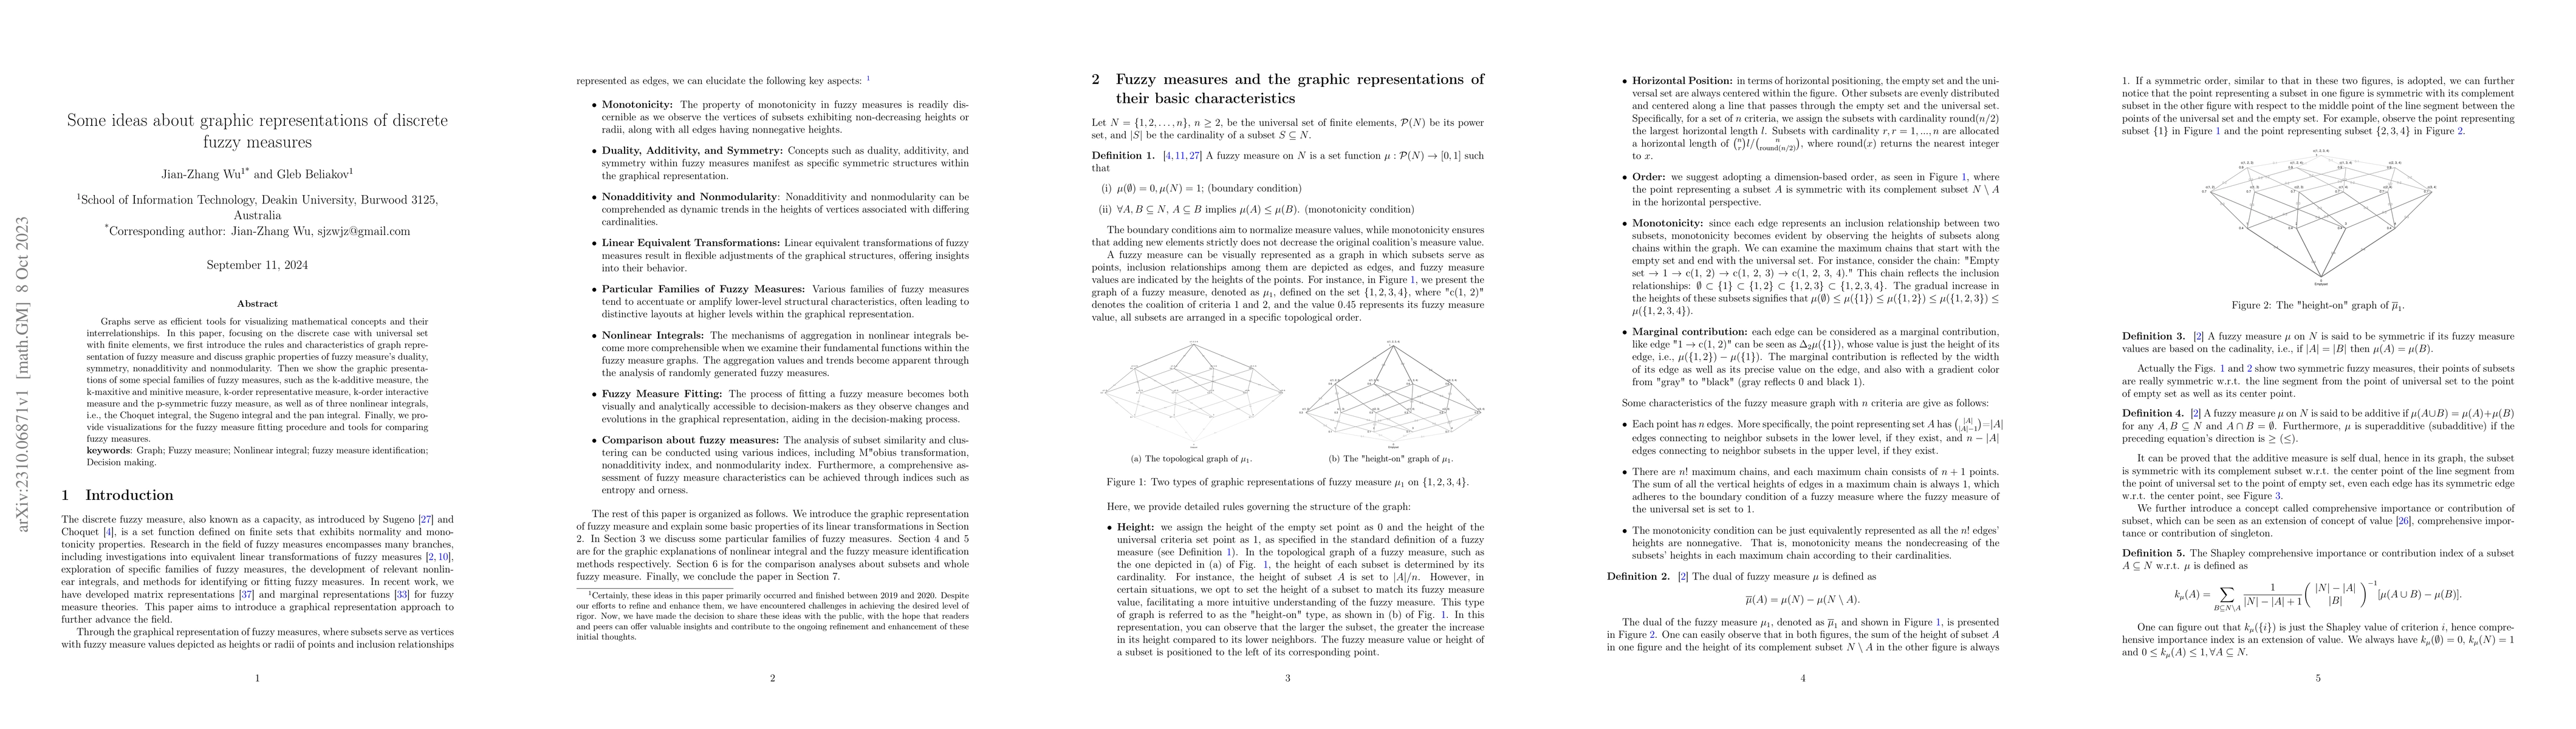
Graphs serve as efficient tools for visualizing mathematical concepts and their interrelationships. In this paper, focusing on the discrete case with universal set with finite elements, we first introduce the rules and characteristics of graph representation of fuzzy measure and discuss graphic properties of fuzzy measure's duality, symmetry, nonadditivity and nonmodularity. Then we show the graphic presentations of some special families of fuzzy measures, such as the k-additive measure, the k-maxitive and minitive measure, k-order representative measure, k-order interactive measure and the p-symmetric fuzzy measure, as well as of three nonlinear integrals, i.e., the Choquet integral, the Sugeno integral and the pan integral. Finally, we provide visualizations for the fuzzy measure fitting procedure and tools for comparing fuzzy measures.
AI Key Findings
Get AI-generated insights about this paper's methodology, results, significance, and more — seven facets brought into focus.
Impact
Paper Details
Authors
PDF Preview
Key Terms
Citation Network
Current paper (gray), citations (green), references (blue)
Display is limited for performance on very large graphs.
Discussion 0