Some statistics about Tropical Sandpile Model
Publication
Metrics
AI Quick Summary
This paper investigates statistical properties of the Tropical Sandpile Model, focusing on the relationship between the number of randomly placed points and the degree of the resulting tropical polynomial. The main findings include the observation that the tropical curve is a small perturbation of standard grid lines and the theoretical result that the curve, excluding the boundary points, forms a tree.
Paper Preview
Abstract
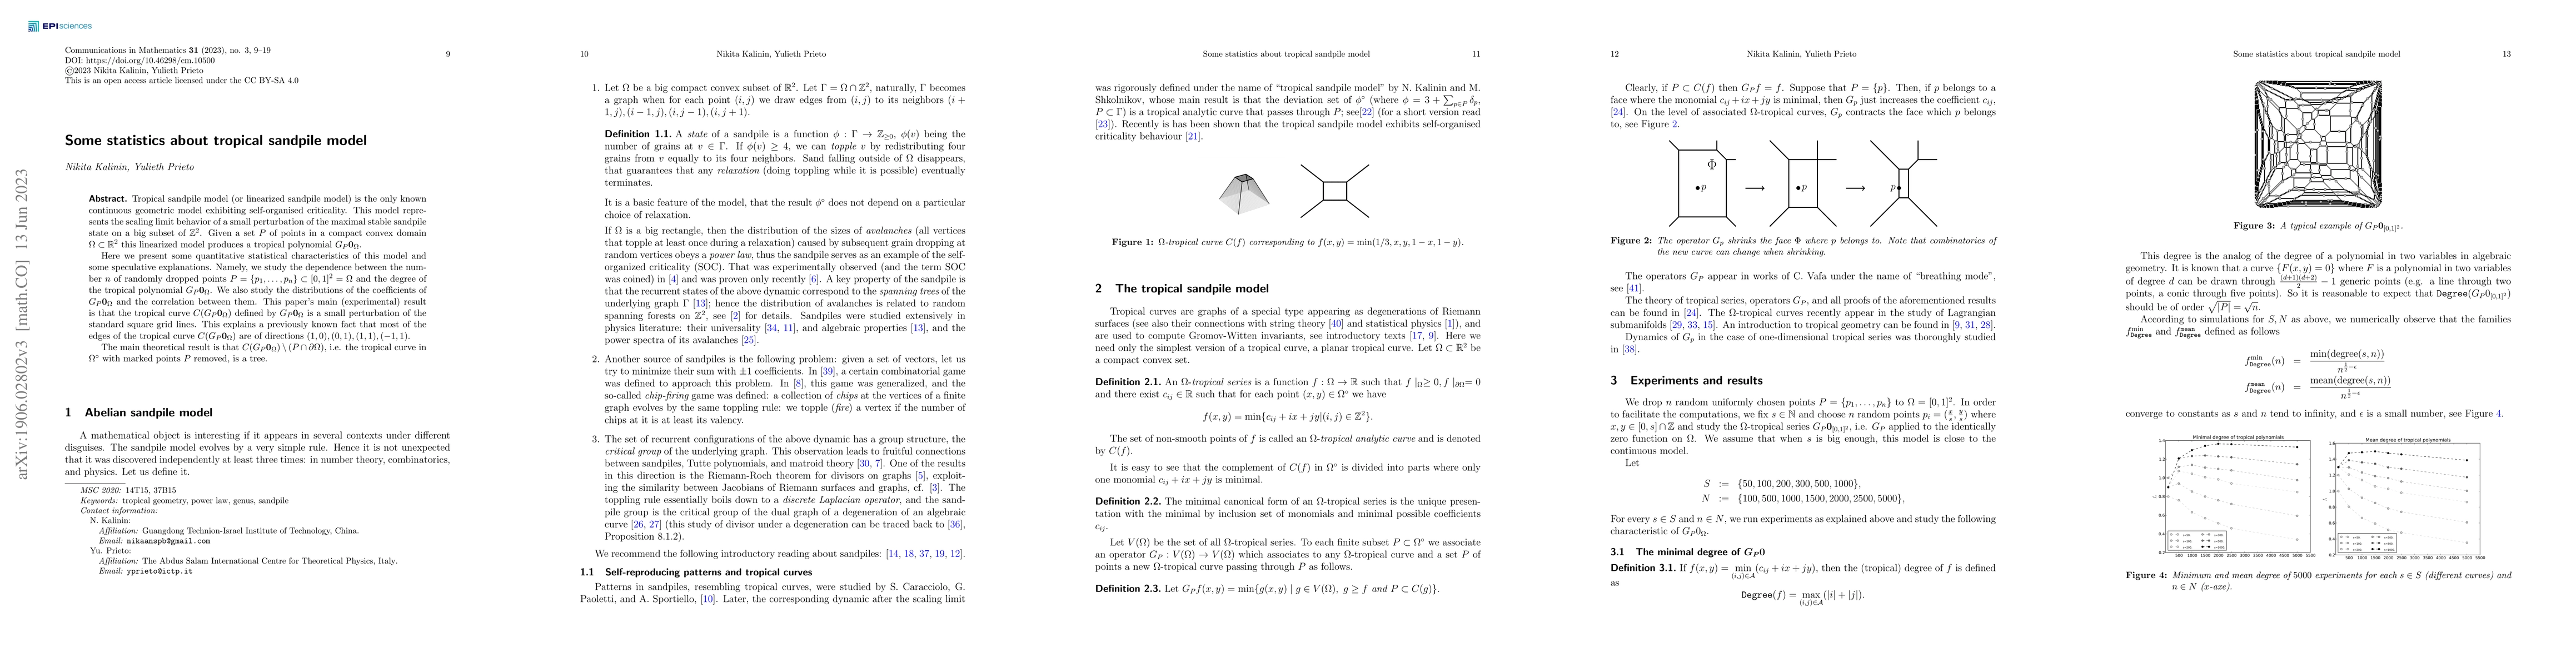
Tropical sandpile model (or linearized sandpile model) is the only known continuous geometric model exhibiting self-organised criticality. This model represents the scaling limit behavior of a small perturbation of the maximal stable sandpile state on a big subset of $\mathbb Z^2$. Given a set $P$ of points in a compact convex domain $\Omega\subset \mathbb R^2$ this linearized model produces a tropical polynomial $G_P{\bf 0}_\Omega$. Here we present some quantitative statistical characteristics of this model and some speculative explanations. Namely, we study the dependence between the number $n$ of randomly dropped points $P=\{p_1,\dots,p_n\}\subset[0,1]^2=\Omega$ and the degree of the tropical polynomial $G_{P}{\bf 0}_\Omega$. We also study the distributions of the coefficients of $G_{P}{\bf 0}_\Omega$ and the correlation between them. This paper's main (experimental) result is that the tropical curve $C(G_{P}{\bf 0}_\Omega)$ defined by $G_{P}{\bf 0}_\Omega$ is a small perturbation of the standard square grid lines. This explains a previously known fact that most of the edges of the tropical curve $C(G_{P}{\bf 0}_\Omega)$ are of directions $(1,0),(0,1),(1,1),(-1,1)$. The main theoretical result is that $C(G_{P}{\bf 0}_\Omega)\setminus (P\cap \partial\Omega)$, i.e. the tropical curve in $\Omega^\circ$ with marked points $P$ removed, is a tree.
AI Key Findings
Get AI-generated insights about this paper's methodology, results, significance, and more — seven facets brought into focus.
Impact
Paper Details
Authors
PDF Preview
Key Terms
Citation Network
Current paper (gray), citations (green), references (blue)
Display is limited for performance on very large graphs.
Discussion 0