Sparse Density Trees and Lists: An Interpretable Alternative to High-Dimensional Histograms
Publication
Metrics
AI Quick Summary
This paper introduces sparse tree-based and list-based density estimation methods for binary/categorical data, offering an interpretable alternative to high-dimensional histograms. These models maintain constant density in each leaf, providing better generalization and visualization capabilities compared to traditional histograms.
Paper Preview
Abstract
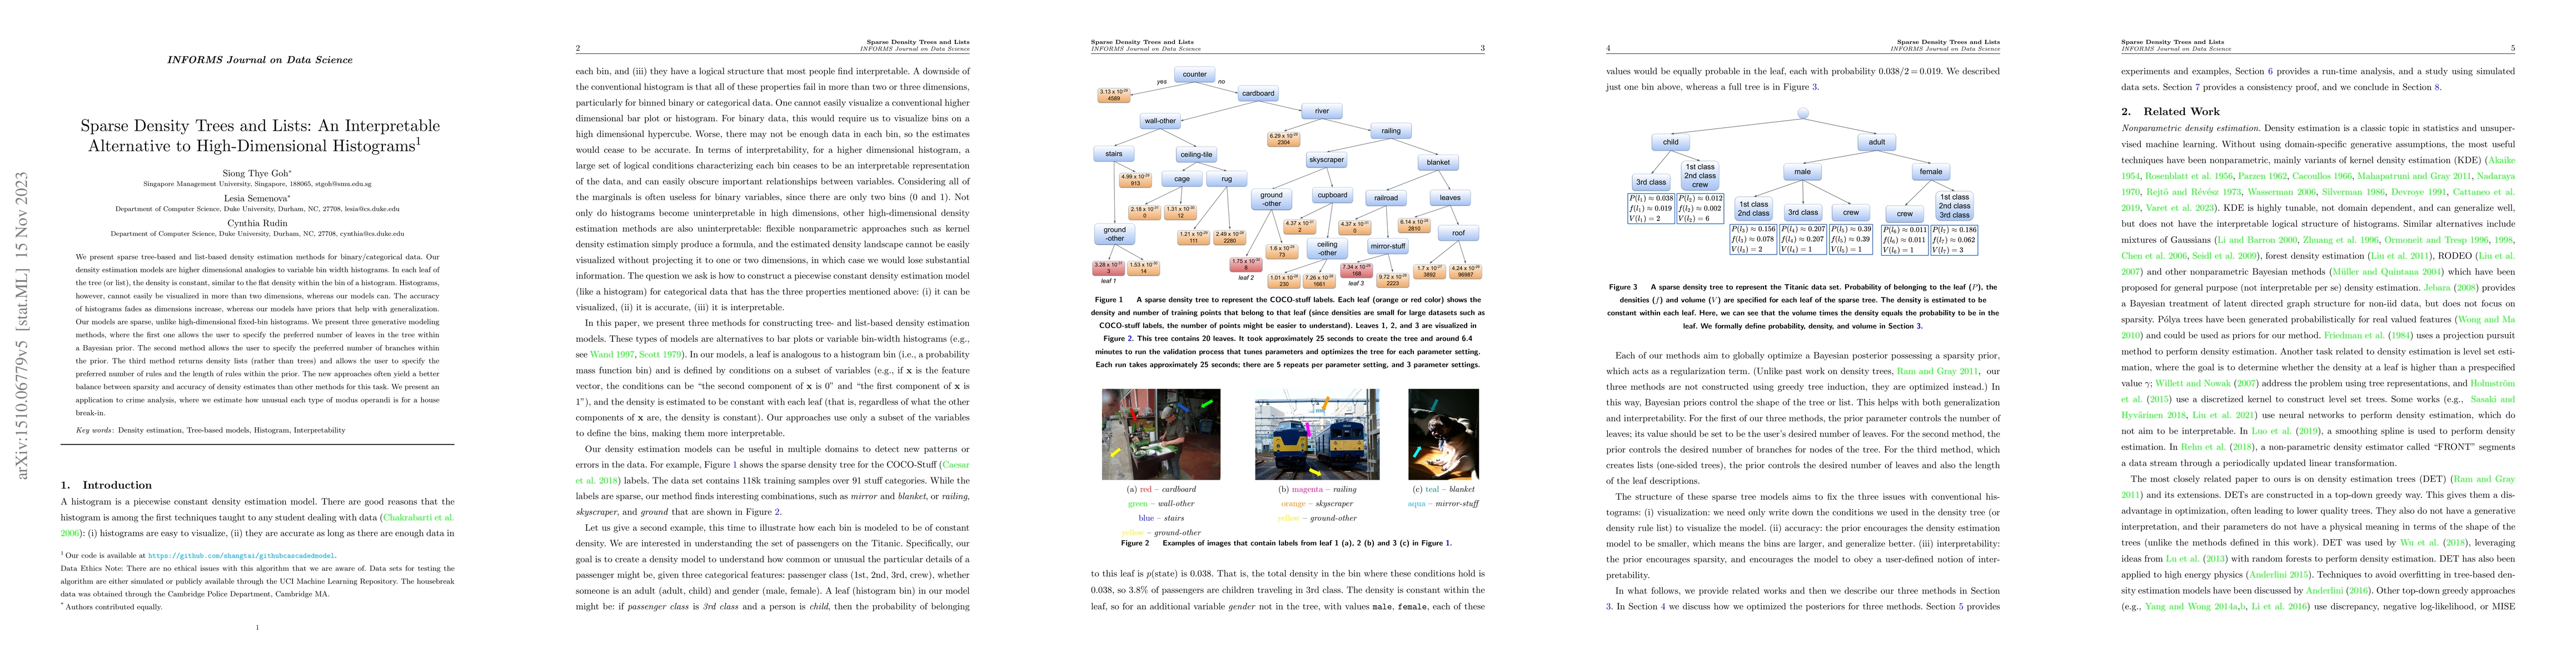
We present sparse tree-based and list-based density estimation methods for binary/categorical data. Our density estimation models are higher dimensional analogies to variable bin width histograms. In each leaf of the tree (or list), the density is constant, similar to the flat density within the bin of a histogram. Histograms, however, cannot easily be visualized in more than two dimensions, whereas our models can. The accuracy of histograms fades as dimensions increase, whereas our models have priors that help with generalization. Our models are sparse, unlike high-dimensional fixed-bin histograms. We present three generative modeling methods, where the first one allows the user to specify the preferred number of leaves in the tree within a Bayesian prior. The second method allows the user to specify the preferred number of branches within the prior. The third method returns density lists (rather than trees) and allows the user to specify the preferred number of rules and the length of rules within the prior. The new approaches often yield a better balance between sparsity and accuracy of density estimates than other methods for this task. We present an application to crime analysis, where we estimate how unusual each type of modus operandi is for a house break-in.
AI Key Findings — Failed
Key findings generation failed. Failed to start generation process
Impact
Paper Details
Authors
PDF Preview
Key Terms
Citation Network
Current paper (gray), citations (green), references (blue)
Display is limited for performance on very large graphs.
Discussion 0