Sparsity exploitation via discovering graphical models in multi-variate time-series forecasting
Publication
Metrics
AI Quick Summary
This paper proposes a decoupled training method for multi-variate time-series forecasting using graph neural networks, leveraging Graphical Lasso to discover sparse, interpretable graph structures. The approach achieves competitive forecasting performance while reducing training time by approximately 40%.
Paper Preview
Abstract
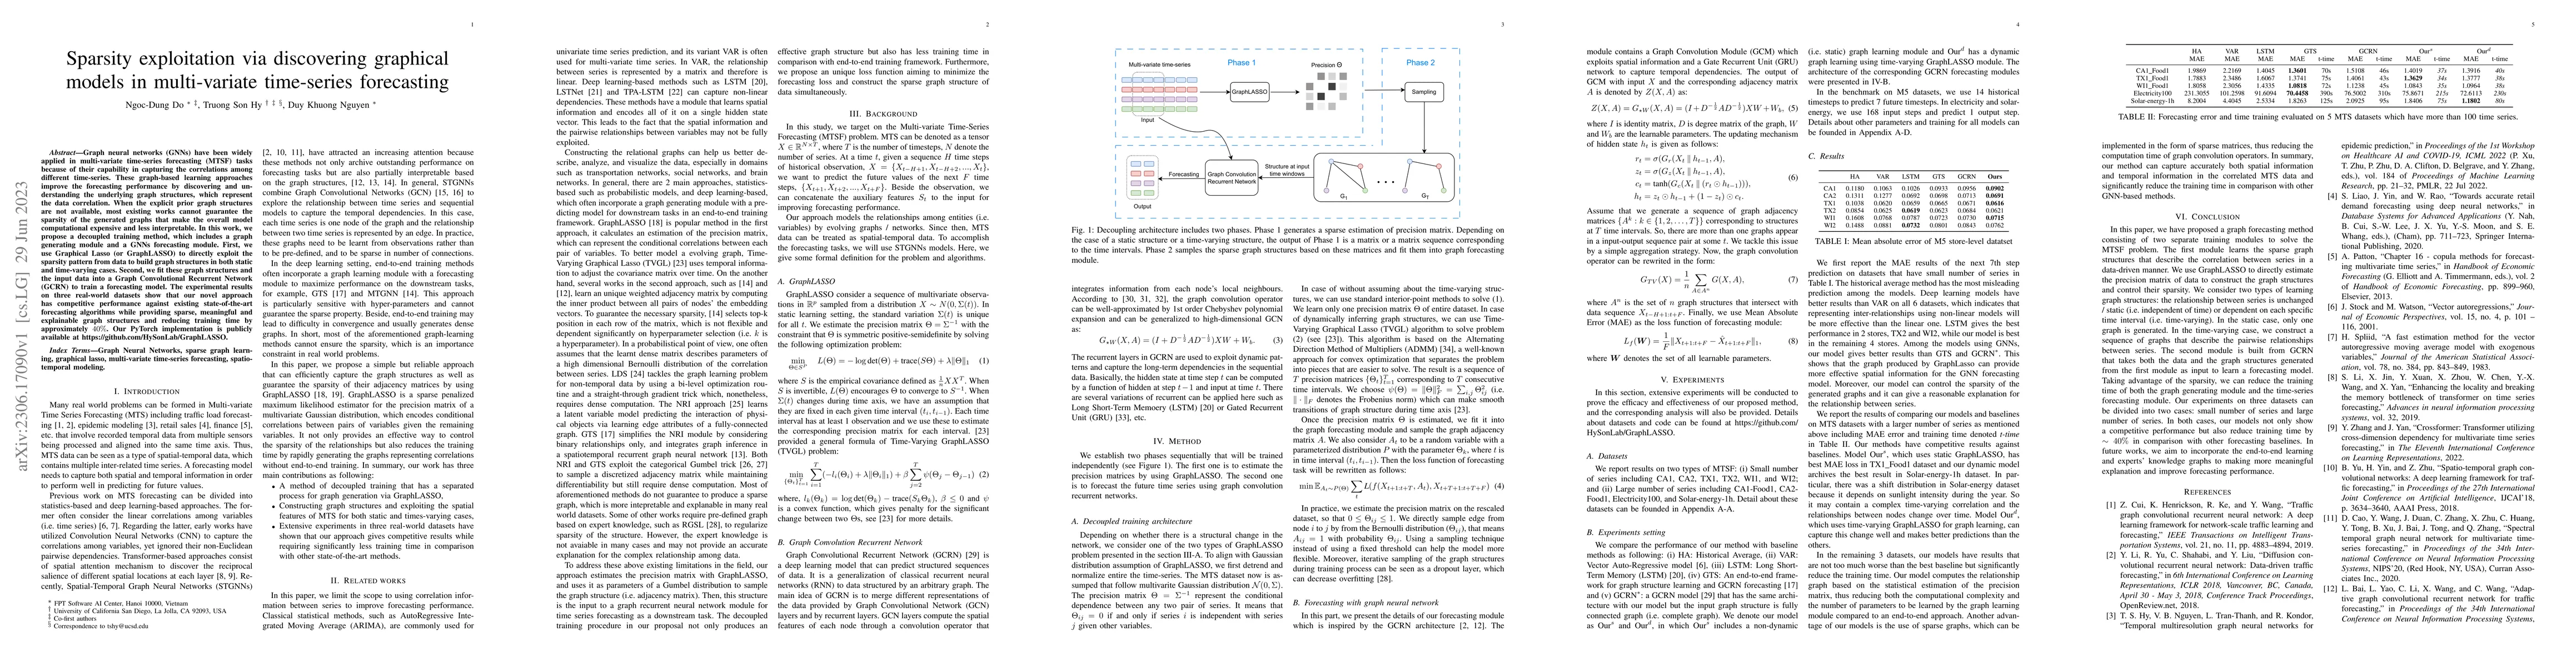
Graph neural networks (GNNs) have been widely applied in multi-variate time-series forecasting (MTSF) tasks because of their capability in capturing the correlations among different time-series. These graph-based learning approaches improve the forecasting performance by discovering and understanding the underlying graph structures, which represent the data correlation. When the explicit prior graph structures are not available, most existing works cannot guarantee the sparsity of the generated graphs that make the overall model computational expensive and less interpretable. In this work, we propose a decoupled training method, which includes a graph generating module and a GNNs forecasting module. First, we use Graphical Lasso (or GraphLASSO) to directly exploit the sparsity pattern from data to build graph structures in both static and time-varying cases. Second, we fit these graph structures and the input data into a Graph Convolutional Recurrent Network (GCRN) to train a forecasting model. The experimental results on three real-world datasets show that our novel approach has competitive performance against existing state-of-the-art forecasting algorithms while providing sparse, meaningful and explainable graph structures and reducing training time by approximately 40%. Our PyTorch implementation is publicly available at https://github.com/HySonLab/GraphLASSO
AI Key Findings
Get AI-generated insights about this paper's methodology, results, significance, and more — seven facets brought into focus.
Impact
Paper Details
Authors
PDF Preview
Key Terms
Citation Network
Current paper (gray), citations (green), references (blue)
Display is limited for performance on very large graphs.
Discussion 0