Spatial data fusion adjusting for preferential sampling using INLA and SPDE
Publication
Metrics
AI Quick Summary
This paper presents a Bayesian spatial fusion model that adjusts for preferential sampling when combining point and areal spatial data, using INLA and SPDE for efficient inference. The model's effectiveness is demonstrated through simulations and applied to predict air pollution in the USA.
Paper Preview
Abstract
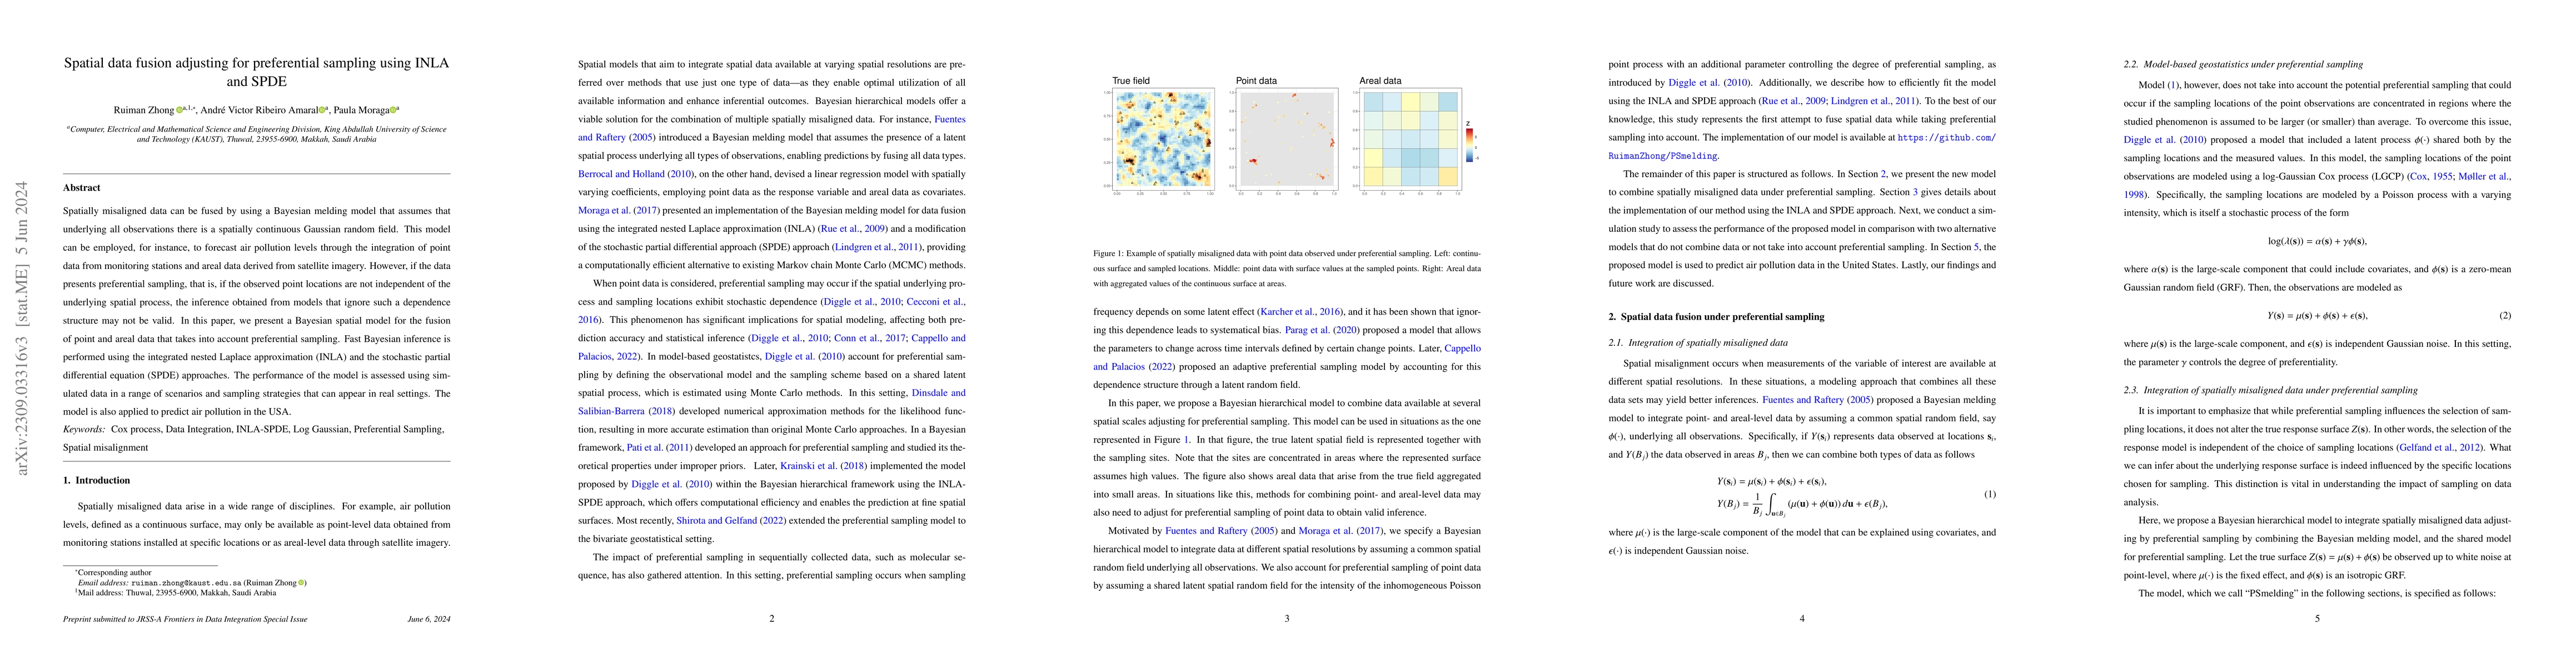
Spatially misaligned data can be fused by using a Bayesian melding model that assumes that underlying all observations there is a spatially continuous Gaussian random field process. This model can be used, for example, to predict air pollution levels by combining point data from monitoring stations and areal data from satellite imagery. However, if the data presents preferential sampling, that is, if the observed point locations are not independent of the underlying spatial process, the inference obtained from models that ignore such a dependence structure might not be valid. In this paper, we present a Bayesian spatial model for the fusion of point and areal data that takes into account preferential sampling. The model combines the Bayesian melding specification and a model for the stochastically dependent sampling and underlying spatial processes. Fast Bayesian inference is performed using the integrated nested Laplace approximation (INLA) and the stochastic partial differential equation (SPDE) approaches. The performance of the model is assessed using simulated data in a range of scenarios and sampling strategies that can appear in real settings. The model is also applied to predict air pollution in the USA.
AI Key Findings
Get AI-generated insights about this paper's methodology, results, significance, and more — seven facets brought into focus.
Impact
Paper Details
Authors
PDF Preview
Key Terms
Citation Network
Current paper (gray), citations (green), references (blue)
Display is limited for performance on very large graphs.
Discussion 0