Summary
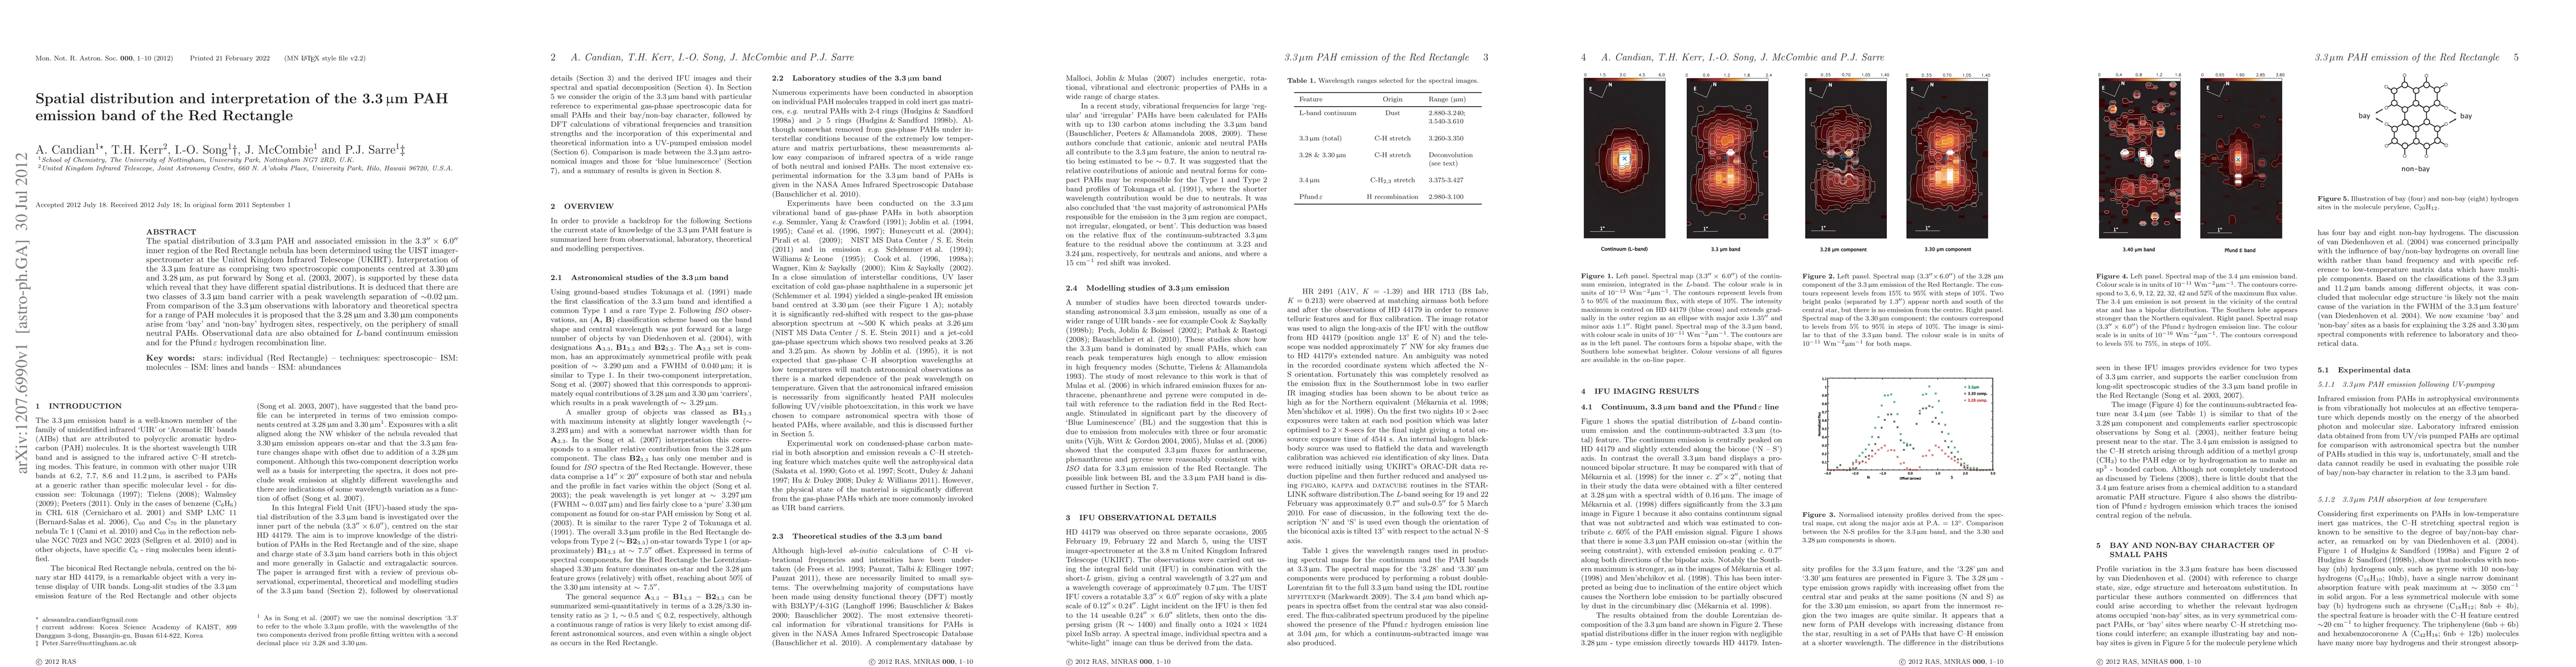
The spatial distribution of 3.3 \mum PAH and associated emission in the 3.3" x 6.0" inner region of the Red Rectangle nebula has been determined using the UIST imager-spectrometer at the United Kingdom Infrared Telescope (UKIRT). Interpretation of the 3.3 \mum feature as comprising two spectroscopic components centred at 3.30 \mum and 3.28 \mum, as put forward by Song et al. (2003, 2007), is supported by these data which reveal that they have different spatial distributions. It is deduced that there are two classes of 3.3 \mum band carrier with a peak wavelength separation of ~0.02 \mum. From comparison of the 3.3 \mum observations with laboratory and theoretical spectra for a range of PAH molecules it is proposed that the 3.28 \mum and 3.30 \mum components arise from 'bay' and 'non-bay' hydrogen sites, respectively, on the periphery of small neutral PAHs. Observational data are also obtained for L-band continuum emission and for the Pfund \epsilon hydrogen recombination line.
AI Key Findings
Get AI-generated insights about this paper's methodology, results, and significance.
Paper Details
PDF Preview
Key Terms
Citation Network
Current paper (gray), citations (green), references (blue)
Display is limited for performance on very large graphs.
Similar Papers
Found 4 papersNot just PAH$_{3.3}$: why galaxies turn red in the Near-Infrared
Xin Wang, Marco Castellano, Lorenzo Napolitano et al.
| Title | Authors | Year | Actions |
|---|
Comments (0)