Publication
Metrics
AI Quick Summary
This paper analyzes the spatial resolution in Electrical Capacitance Tomography (ECT) sensors, focusing on the accuracy of object positioning and the ability to distinguish close objects. The study finds that in cylindrical geometries, a 50% electrode gap is optimal, with more electrodes enhancing edge resolution but reducing central resolution, while square geometry sensors benefit from corner electrodes for better overall resolution distribution.
Paper Preview
Abstract
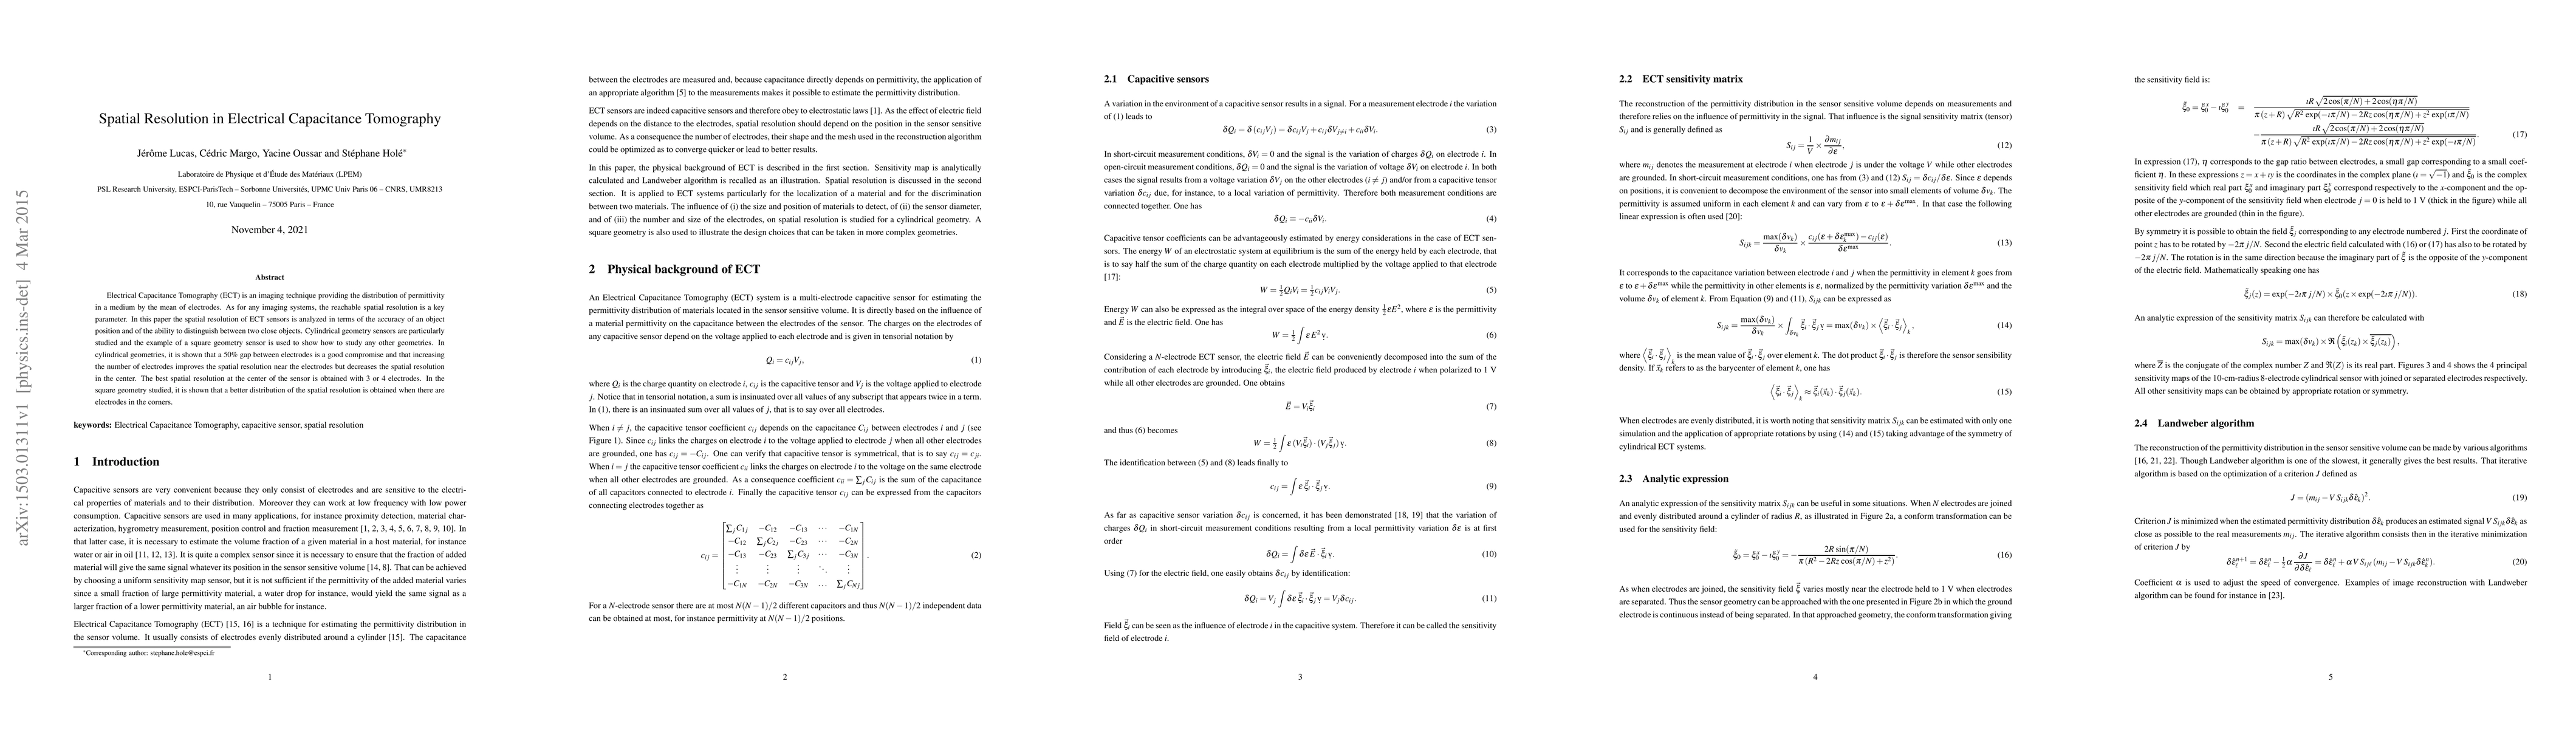
Electrical Capacitance Tomography (ECT) is an imaging technique providing the distribution of permittivity in a medium by the mean of electrodes. As for any imaging systems, the reachable spatial resolution is a key parameter. In this paper the spatial resolution of ECT sensors is analyzed in terms of the accuracy of an object position and of the ability to distinguish between two close objects. Cylindrical geometry sensors are particularly studied and the example of a square geometry sensor is used to show how to study any other geometries. In cylindrical geometries, it is shown that a 50% gap between electrodes is a good compromise and that increasing the number of electrodes improves the spatial resolution near the electrodes but decreases the spatial resolution in the center. The best spatial resolution at the center of the sensor is obtained with 3 or 4 electrodes. In the square geometry studied, it is shown that a better distribution of the spatial resolution is obtained when there are electrodes in the corners.
AI Key Findings
Get AI-generated insights about this paper's methodology, results, significance, and more — seven facets brought into focus.
Impact
Paper Details
PDF Preview
Key Terms
Citation Network
Current paper (gray), citations (green), references (blue)
Display is limited for performance on very large graphs.
Discussion 0