Spatial Scales and Time Variation of Solar Subsurface Convection
Publication
Metrics
AI Quick Summary
This study analyzes solar subphotospheric convection using time-distance helioseismology and finds that horizontal flow scales increase with depth, indicating large-scale convective motions. The total power of convective flows correlates inversely with sunspot numbers in shallow layers but positively at greater depths, suggesting depth redistribution of convective-flow energy influenced by magnetic fields.
Paper Preview
Abstract
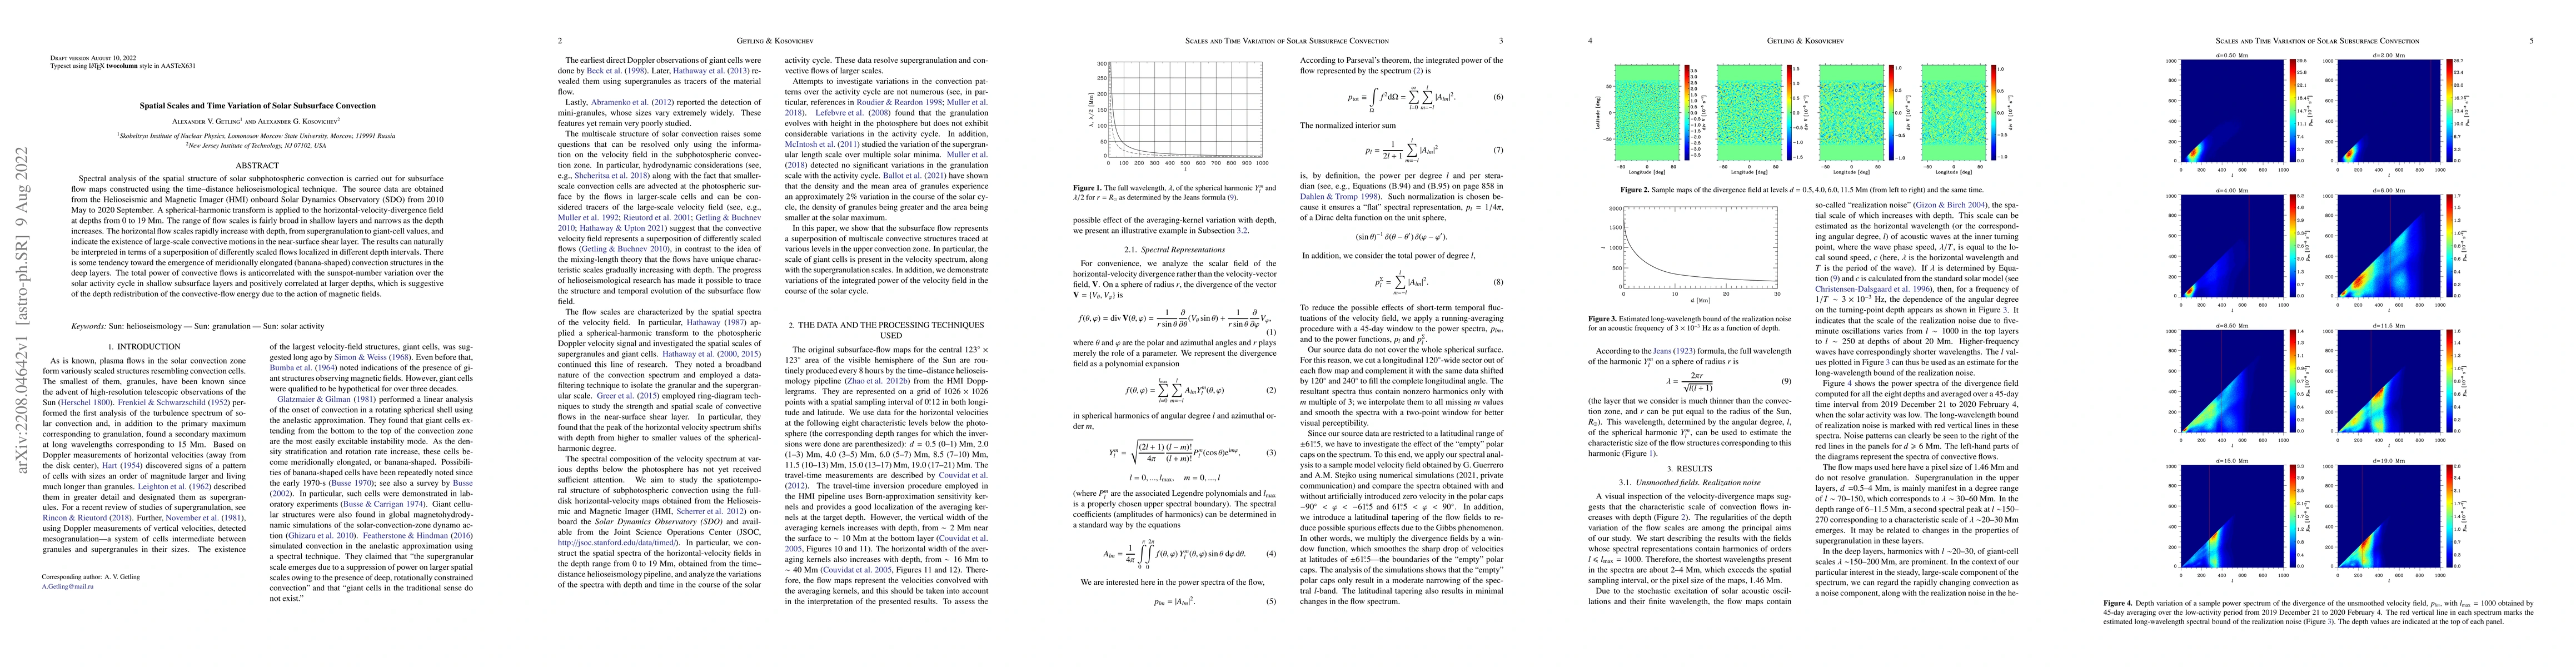
Spectral analysis of the spatial structure of solar subphotospheric convection is carried out for subsurface flow maps constructed using the time--distance helioseismological technique. The source data are obtained from the Helioseismic and Magnetic Imager (HMI) onboard Solar Dynamics Observatory (SDO) from 2010 May to 2020 September. A spherical-harmonic transform is applied to the horizontal-velocity-divergence field at depths from 0 to 19~Mm. The range of flow scales is fairly broad in shallow layers and narrows as the depth increases. The horizontal flow scales rapidly increase with depth, from supergranulation to giant-cell values, and indicate the existence of large-scale convective motions in the near-surface shear layer. The results can naturally be interpreted in terms of a superposition of differently scaled flows localized in different depth intervals. There is some tendency toward the emergence of meridionally elongated (banana-shaped) convection structures in the deep layers. The total power of convective flows is anticorrelated with the sunspot-number variation over the solar activity cycle in shallow subsurface layers and positively correlated at larger depths, which is suggestive of the depth redistribution of the convective-flow energy due to the action of magnetic fields.
AI Key Findings
Get AI-generated insights about this paper's methodology, results, significance, and more — seven facets brought into focus.
Impact
Paper Details
Authors
PDF Preview
Key Terms
Citation Network
Current paper (gray), citations (green), references (blue)
Display is limited for performance on very large graphs.
Discussion 0