Spatial-temporal forecasting the sunspot diagram
Publication
Metrics
AI Quick Summary
This research forecasts the Sun's sunspot butterfly diagram in both space and time using a high-dimensional non-linear data embedding method. While it successfully reconstructs the spatial-temporal pattern, it lacks predictive power for future sunspots. The paper also introduces structural similarity as a useful metric for comparing forecasted and observed cycles.
Paper Preview
Abstract
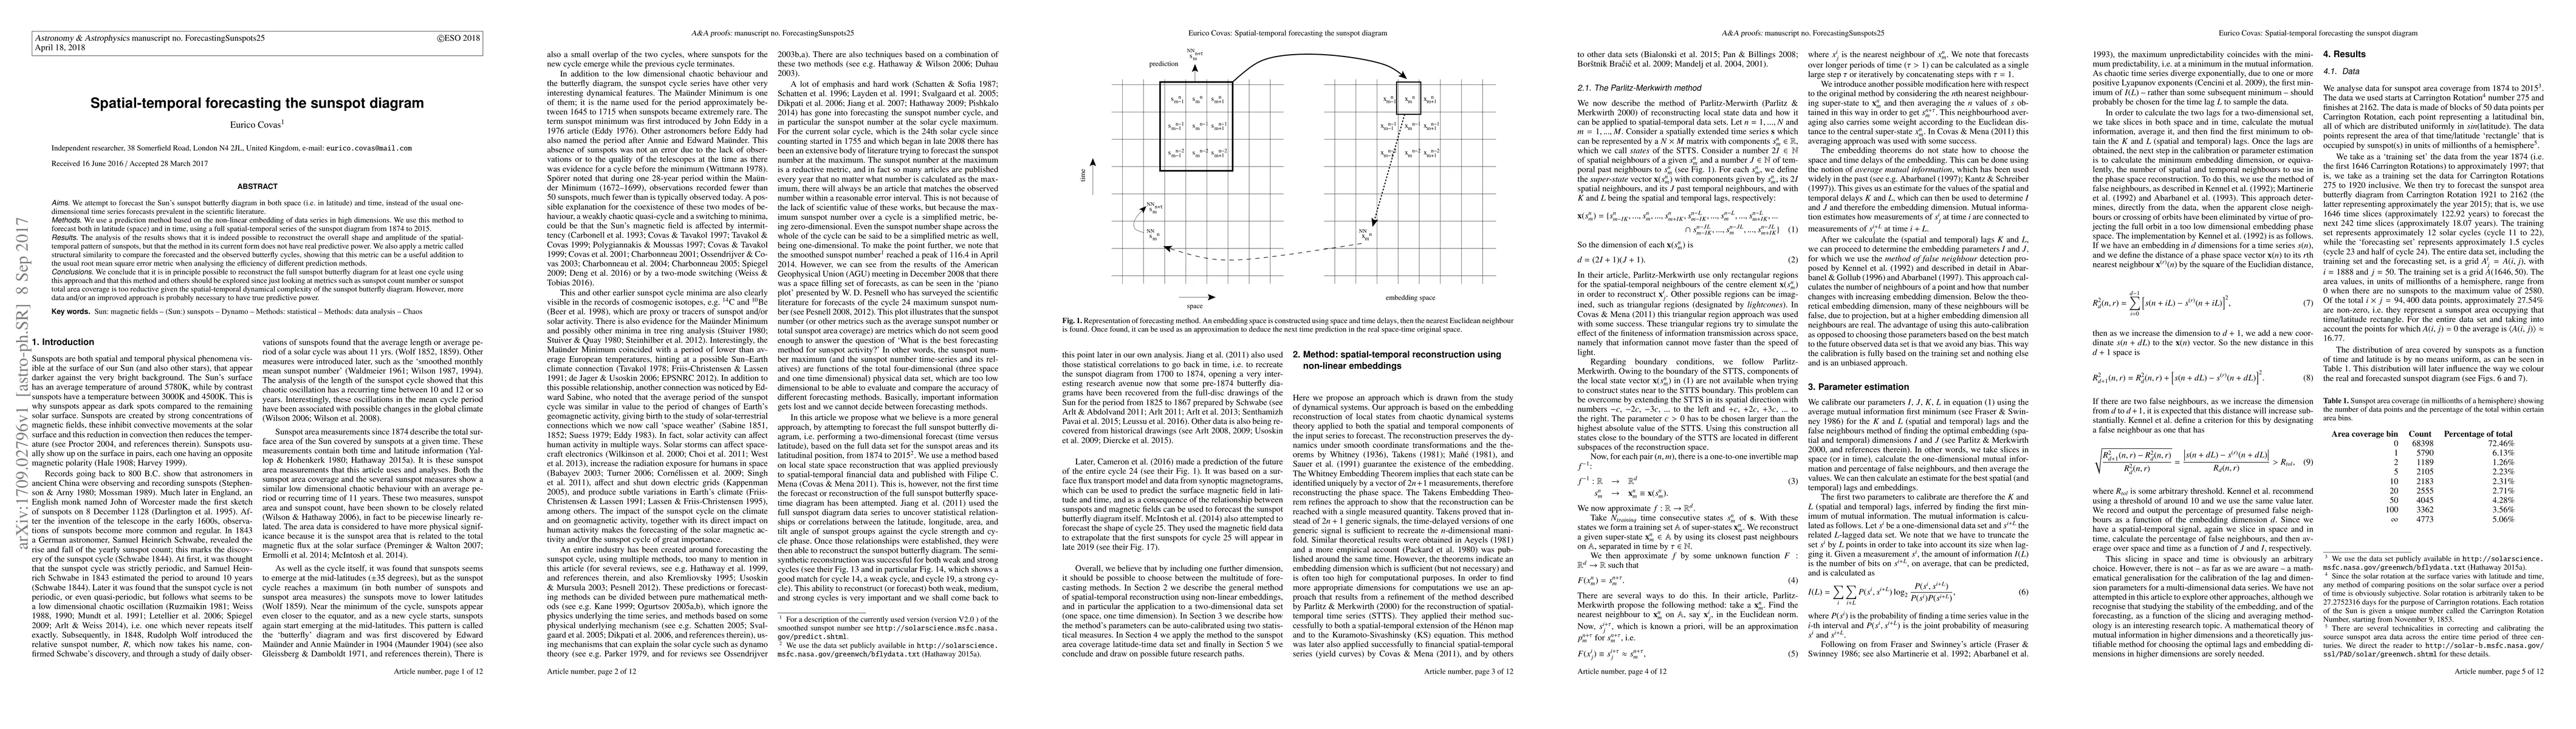
We attempt to forecast the Sun's sunspot butterfly diagram in both space (i.e. in latitude) and time, instead of the usual one-dimensional time series forecasts prevalent in the scientific literature. We use a prediction method based on the non-linear embedding of data series in high dimensions. We use this method to forecast both in latitude (space) and in time, using a full spatial-temporal series of the sunspot diagram from 1874 to 2015. The analysis of the results shows that it is indeed possible to reconstruct the overall shape and amplitude of the spatial-temporal pattern of sunspots, but that the method in its current form does not have real predictive power. We also apply a metric called structural similarity to compare the forecasted and the observed butterfly cycles, showing that this metric can be a useful addition to the usual root mean square error metric when analysing the efficiency of different prediction methods.
AI Key Findings
Get AI-generated insights about this paper's methodology, results, significance, and more — seven facets brought into focus.
Impact
Paper Details
PDF Preview
Key Terms
Citation Network
Current paper (gray), citations (green), references (blue)
Display is limited for performance on very large graphs.
Discussion 0