Summary
High-resolution energy consumption and emissions datasets are essential for localized policy-making, resource optimization, and climate action planning. They enable municipalities to monitor mitigation strategies and foster engagement among governments, businesses, and communities. However, smaller municipalities often face data limitations that hinder tailored climate strategies. This study generates detailed final energy consumption and emissions data at the local administrative level for Germany and Spain. Using national datasets, we apply spatial disaggregation techniques with open data sources. A key innovation is the application of XGBoost for imputing missing data, combined with a stepwise spatial disaggregation process incorporating district- and province-level statistics. Prioritizing reproducibility, our open-data approach provides a scalable framework for municipalities to develop actionable climate plans. To ensure transparency, we assess the reliability of imputed values and assign confidence ratings to the disaggregated data.
AI Key Findings
Get AI-generated insights about this paper's methodology, results, and significance.
Paper Details
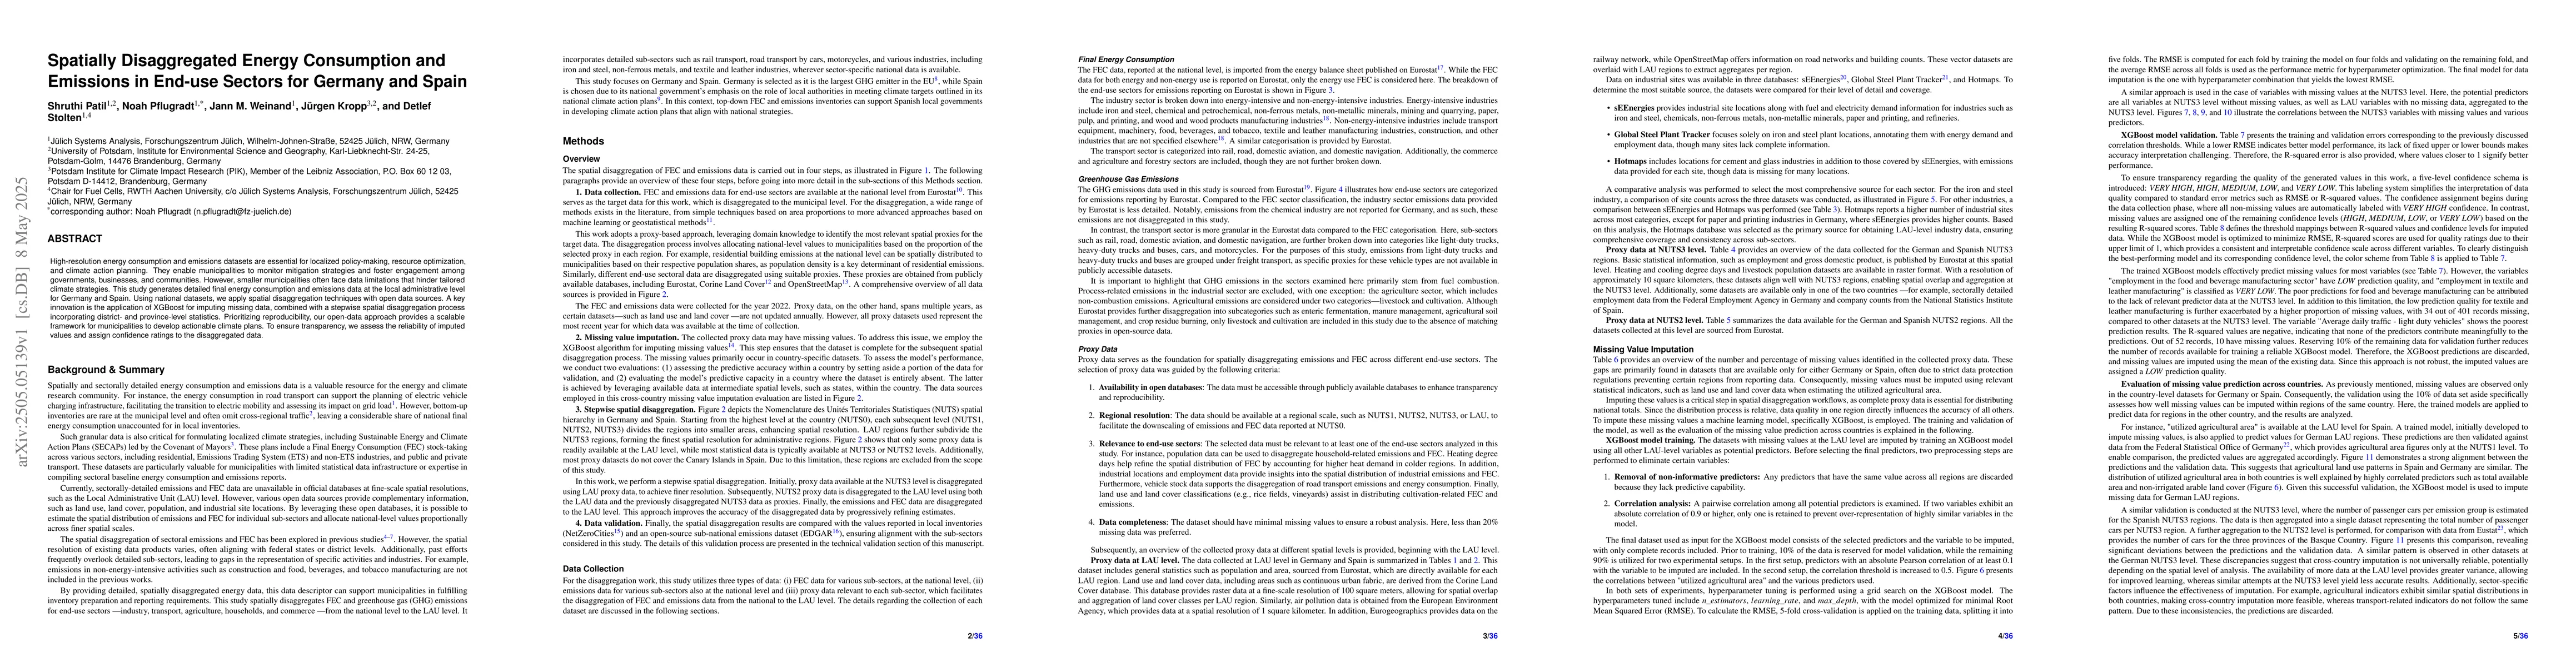
PDF Preview
Citation Network
Current paper (gray), citations (green), references (blue)
Display is limited for performance on very large graphs.
Similar Papers
Found 4 papersQuantifying the Energy Consumption and Carbon Emissions of LLM Inference via Simulations
Philipp Wiesner, Odej Kao, Philipp Weiß et al.
Minimizing Energy Consumption for End-to-End Slicing in 5G Wireless Networks and Beyond
Mehdi Rasti, Pedro H. J. Nardelli, Shiva Kazemi Taskou
No citations found for this paper.
Comments (0)