Publication
Metrics
AI Quick Summary
This study uses two techniques to measure vertical vorticity in solar supergranules at different latitudes, finding that outflows have clockwise tangential flows of up to 10 m/s and inflows have anti-clockwise flows of the same magnitude.
Paper Preview
Abstract
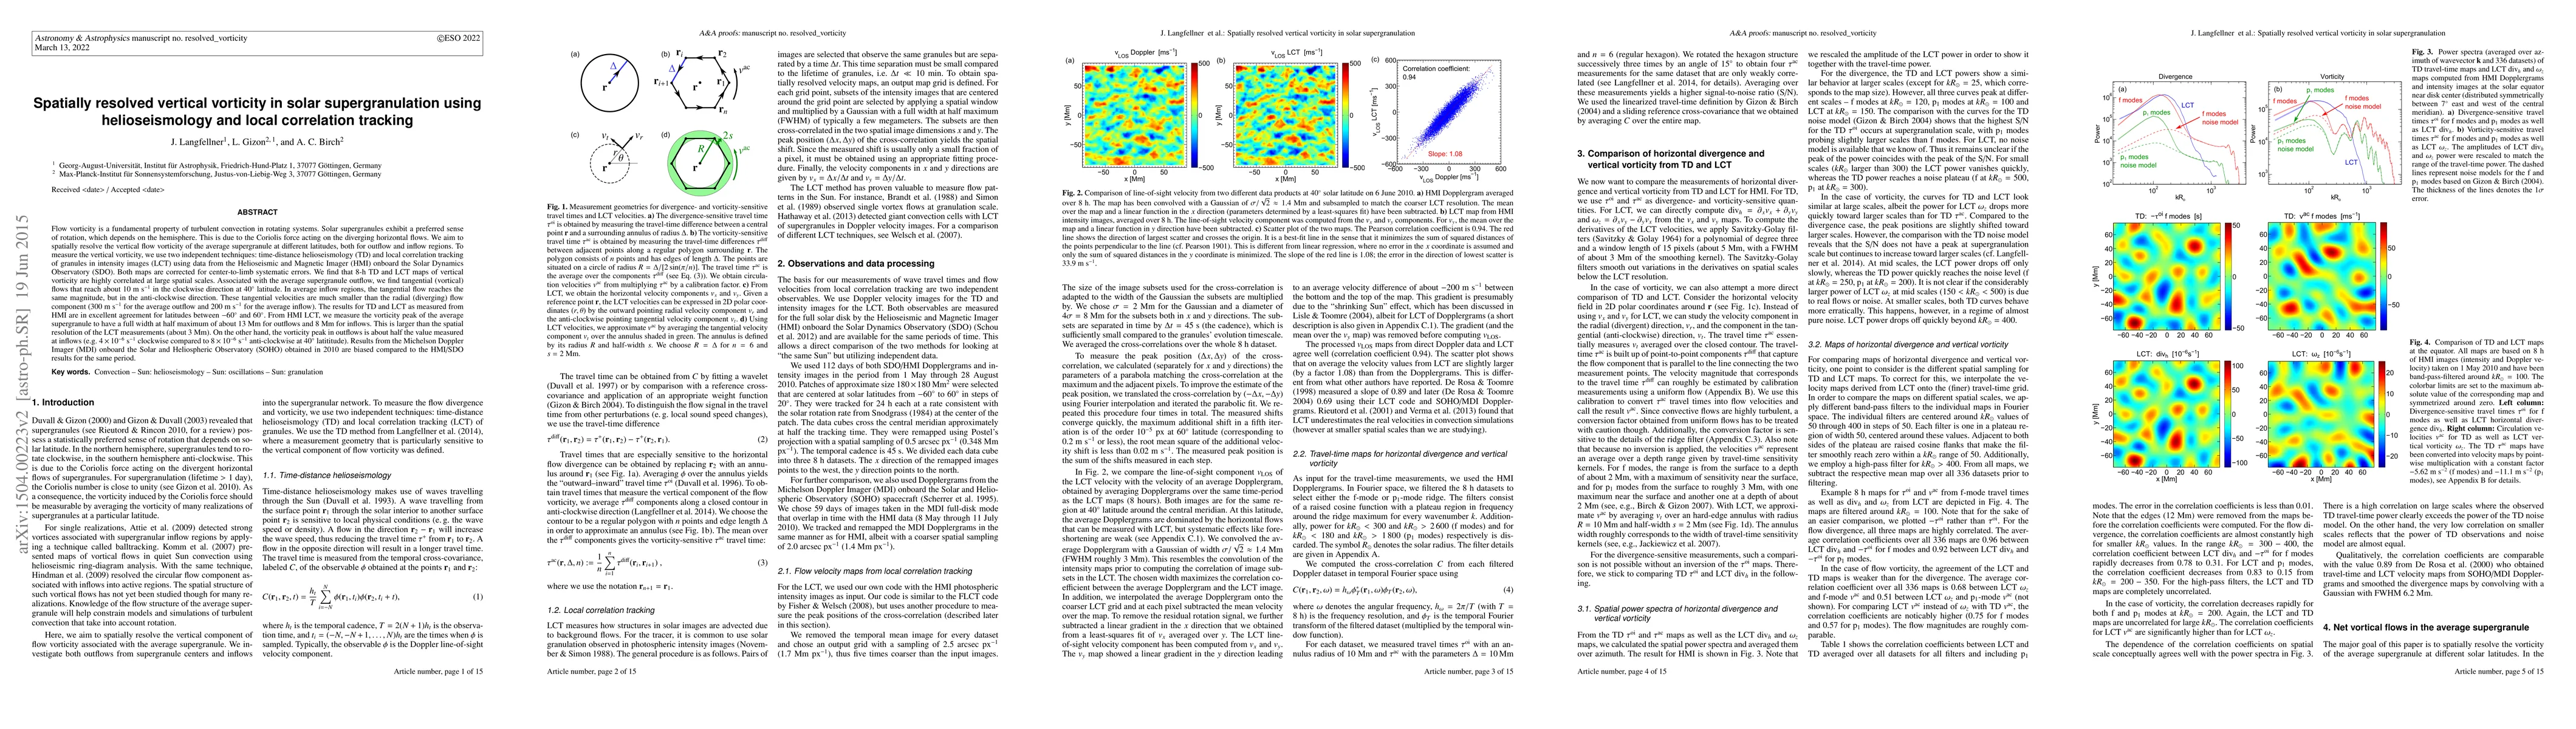
Flow vorticity is a fundamental property of turbulent convection in rotating systems. Solar supergranules exhibit a preferred sense of rotation, which depends on the hemisphere. This is due to the Coriolis force acting on the diverging horizontal flows. We aim to spatially resolve the vertical flow vorticity of the average supergranule at different latitudes, both for outflow and inflow regions. To measure the vertical vorticity, we use two independent techniques: time-distance helioseismology (TD) and local correlation tracking of granules in intensity images (LCT) using data from the Helioseismic and Magnetic Imager (HMI) onboard the Solar Dynamics Observatory (SDO). Both maps are corrected for center-to-limb systematic errors. We find that 8-h TD and LCT maps of vertical vorticity are highly correlated at large spatial scales. Associated with the average supergranule outflow, we find tangential (vortical) flows that reach about 10 m/s in the clockwise direction at 40{\deg} latitude. In average inflow regions, the tangential flow reaches the same magnitude, but in the anti-clockwise direction. These tangential velocities are much smaller than the radial (diverging) flow component (300 m/s for the average outflow and 200 m/s for the average inflow). The results for TD and LCT as measured from HMI are in excellent agreement for latitudes between $-$60{\deg} and 60{\deg}. From HMI LCT, we measure the vorticity peak of the average supergranule to have a full width at half maximum of about 13 Mm for outflows and 8 Mm for inflows. This is larger than the spatial resolution of the LCT measurements (about 3 Mm). On the other hand, the vorticity peak in outflows is about half the value measured at inflows (e.g. 4/(10^6 s) clockwise compared to 8/(10^6 s) anti-clockwise at 40{\deg} latitude). Results from MDI/SOHO obtained in 2010 are biased compared to the HMI/SDO results for the same period.
AI Key Findings
Get AI-generated insights about this paper's methodology, results, significance, and more — seven facets brought into focus.
Impact
Paper Details
PDF Preview
Key Terms
Citation Network
Current paper (gray), citations (green), references (blue)
Display is limited for performance on very large graphs.
Discussion 0